XLF 27-day bullish forecast — Nov 8, 2026
- Bias: Bullish
- Timeframe: 27 days (made Nov 8, 2026, target date Dec 4, 2026)
- Price at analysis: $57.16
- Price target: $58.20
- Expected range: $54.40 – $60.70
- Result: Pending — graded after the close on Dec 4, 2026
Get a free AI analysis of XLF today
Analysis
TECHNICAL INDICATORS
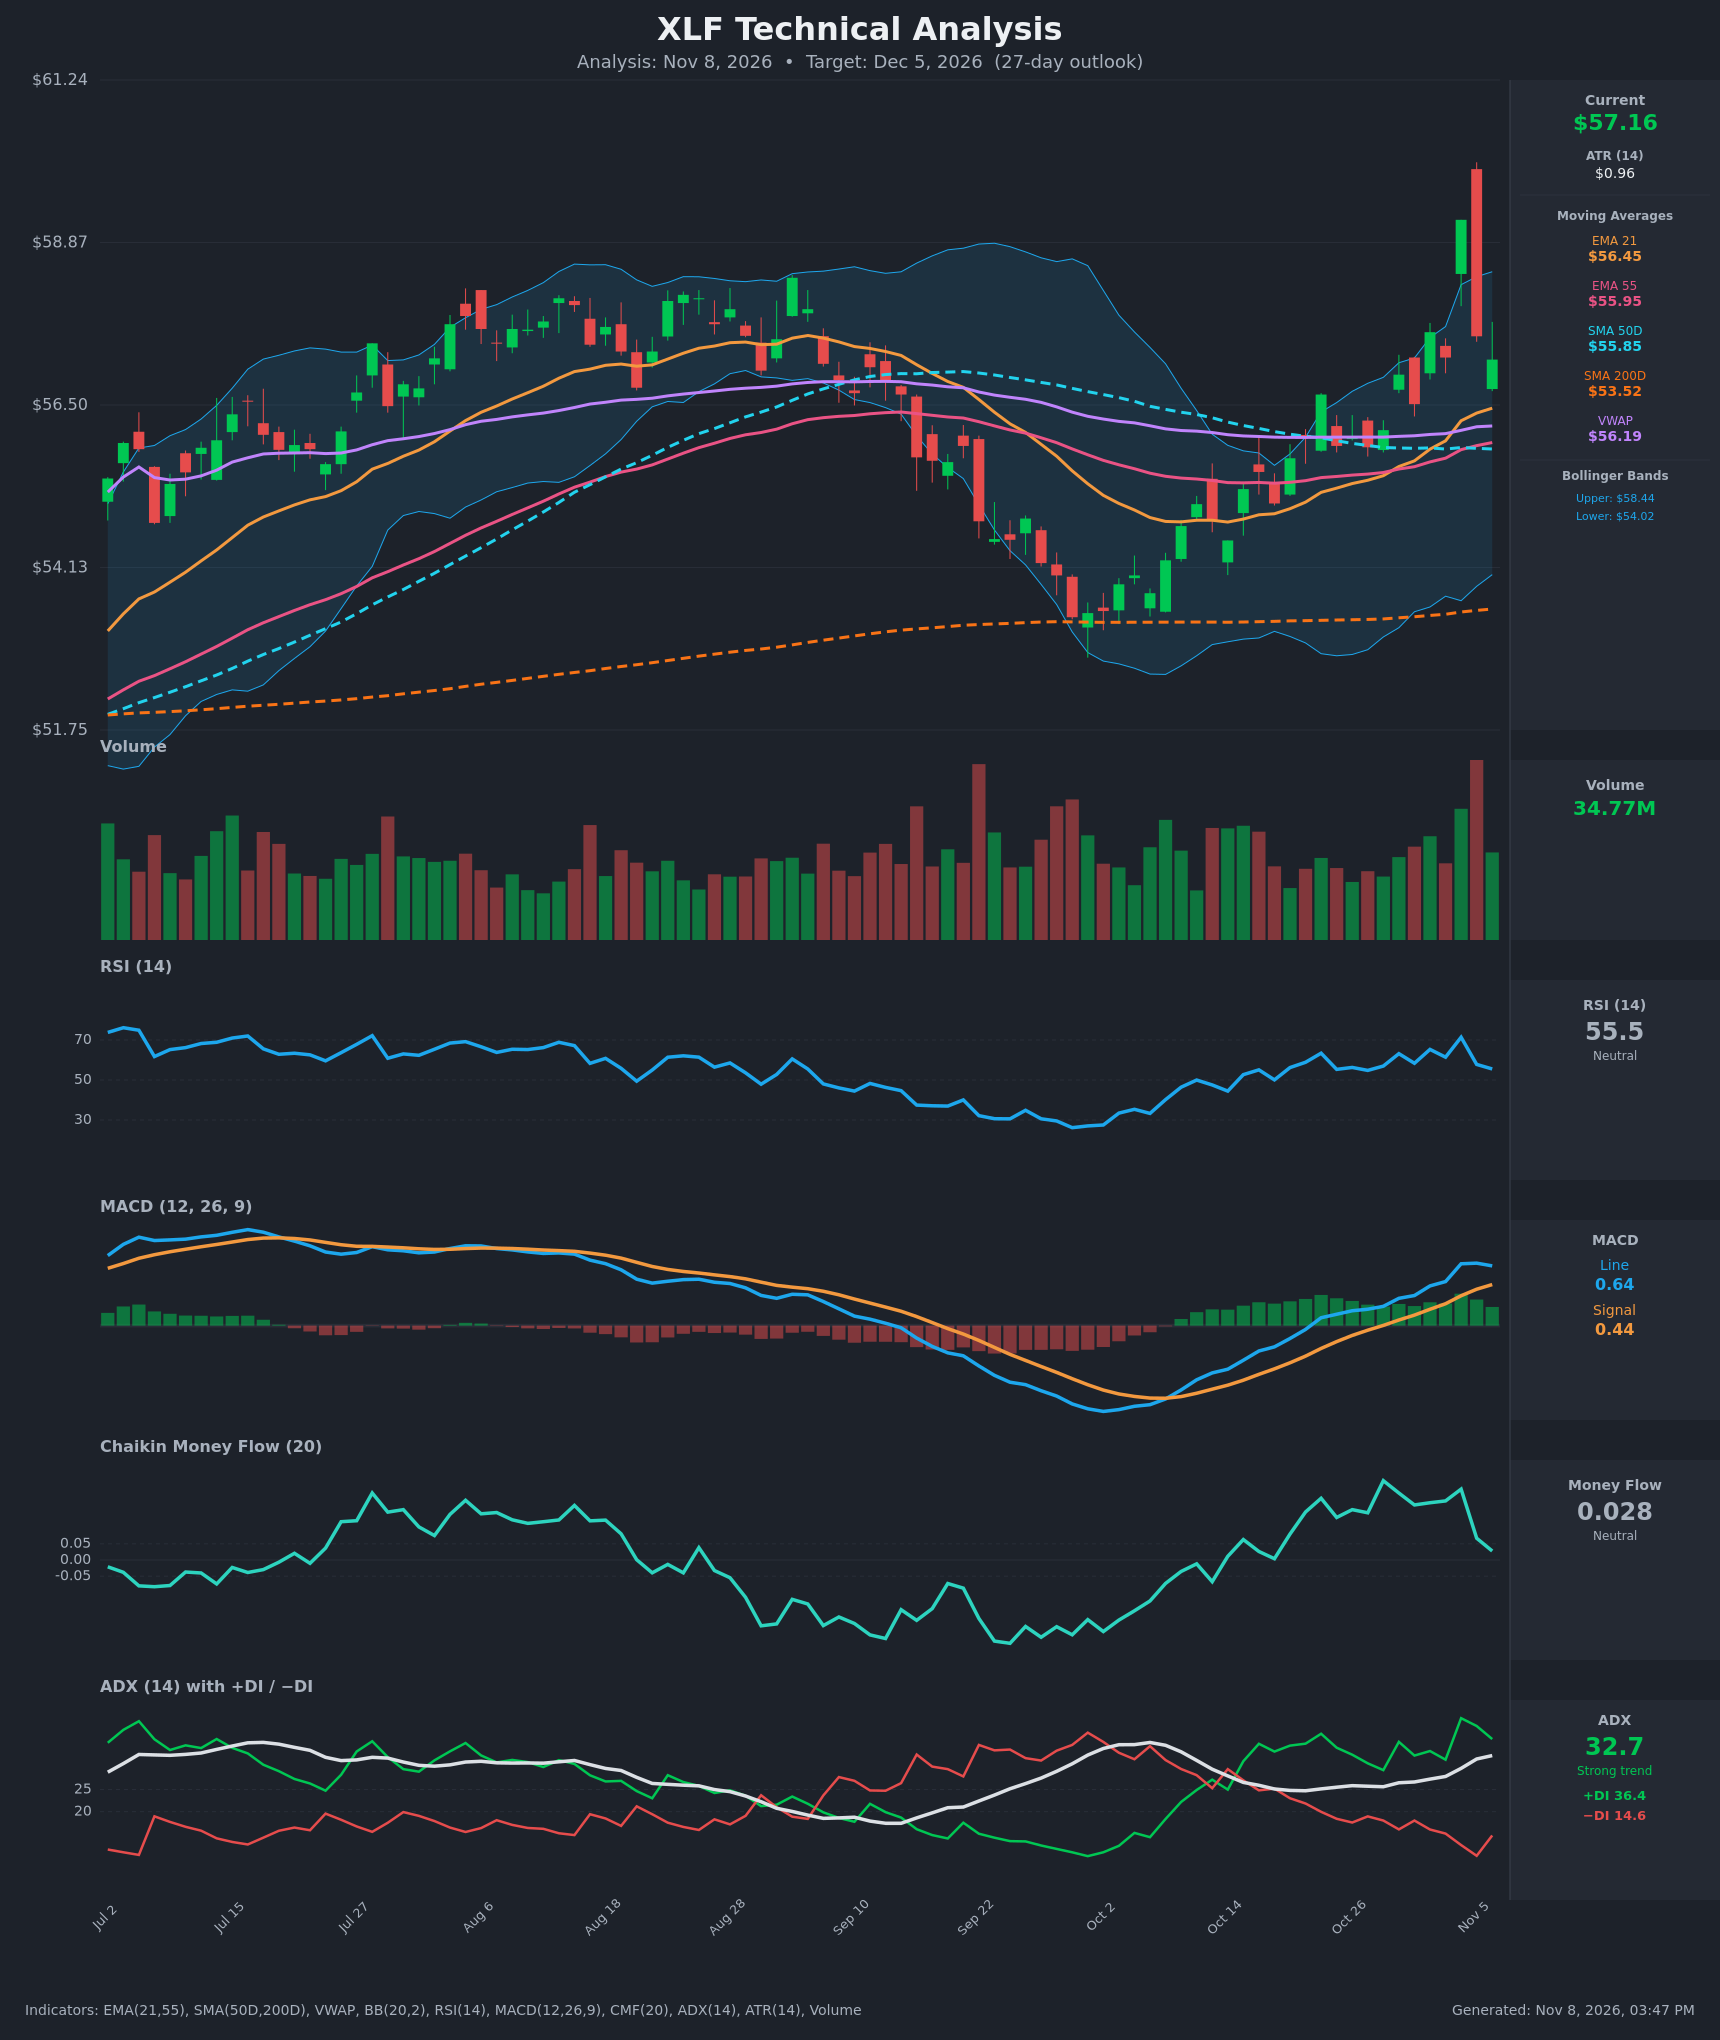
- RSI (14): 55.5, down from 71.4 on Nov 4 and now back near the midline. The overbought spike has fully reset, so there is room to run, but short-term momentum is cooling. [Neutral]
- 20 EMA: EMA21 is $56.45 and price ($57.16) is about 1.3% above it. EMA21 is above EMA55 ($55.95) and both are rising, so the EMA21 zone should act as first support on pullbacks. [Bullish]
- MACD: Line 0.644 is above signal 0.443, and the bullish crossover happened on Oct 28. The histogram is positive at about +0.20 but has narrowed from about +0.28 on Nov 5, so momentum is positive and flattening. [Bullish]
- Bollinger Bands (20): Upper $58.44, lower $54.02, midline about $56.2. Price sits in the upper half after Tuesday's spike above the upper band. The bands are widening, which signals expanding volatility, and there is more room to the upside than the downside. [Bullish]
- CMF (20): 0.028, inside the ±0.05 neutral zone. It has fallen from 0.219 on Nov 4, so accumulation has faded and buyers are less aggressive on the pullback. [Neutral]
- ADX (14): 32.7 and rising, with +DI 36.4 well above −DI 14.6. This is a strong, established uptrend with bulls firmly in control. [Strong Trend + Bullish]
- Volume: 34.77M. The Nov 4 spike came on the heaviest volume of the period and closed as a large red-bodied reversal candle, which suggests short-term exhaustion or profit-taking. The following sessions show normal volume with no heavy follow-through selling. [Mixed / Neutral]
DIVERGENCES & TRENDS
- Price is above the VWAP ($56.19), EMA21, EMA55, SMA50D ($55.85) and SMA200D ($53.52). The golden cross has already occurred (SMA50D above SMA200D), which confirms a long-term uptrend.
- The EMA21/EMA55 bullish crossover occurred around Oct 29, and the MACD bullish crossover around Oct 28. Both are fresh trend signals.
- RSI and CMF are falling from their Nov 4 peaks while price holds around $57. This is short-term momentum cooling rather than a true bearish divergence, because price has not made a new high on weaker readings.
- The failed push to the $59+ area on Nov 4 closed with a long upper wick, which marks overhead supply. Because that high was not confirmed by the follow-up closes, it is a caution flag.
- The October 2 low (about $53.3) was held by the SMA200D. Since then price has made higher lows and higher highs.
CHART PATTERNS
- The Sept–Oct decline followed by a sharp recovery resembles a Bullish Double Bottom / V-shaped reversal off the SMA200D around $53.3–$53.5. The recovery has cleared the August highs near $57.9.
- The Nov 4 spike and reversal candle is a possible short-term "failed breakout" (a bearish single-bar signal). It resembles the first leg of a Bearish Double Top if $59.20 is retested and rejected. That is not confirmed yet.
- The current pullback toward $56.5–$57 looks like a Bullish Flag-style digestion after the impulse. A move above $58.44–$59.20 would project toward about $60–$60.50, roughly the measured move of the prior leg.
- The bullish structure carries more weight than the bearish one given ADX, +DI dominance and the stack of moving averages below price.
POTENTIAL SCENARIOS
- Scenario 1: Bullish Trend Continuation — The pullback holds above the EMA21/VWAP zone and buyers resume control, driven by the strong ADX and positive MACD. Trigger: daily close above $58.44 (upper Bollinger Band), then above $59.20. Target: $58.50–$60.00. Invalidation: daily close below $55.85 (SMA50D/EMA55 cluster). (55% probability)
- Scenario 2: Neutral Consolidation Under Resistance — The Nov 4 high caps price and XLF digests gains between the moving averages while RSI and CMF reset. Trigger: repeated rejection at $58.4–$59.2 with support at $56.2. Target: $56.20–$58.40 range. Invalidation: a close above $59.20 or below $55.85. (25% probability)
- Scenario 3: Bearish Failed Breakout / Deeper Pullback — The Nov 4 reversal candle proves to be a blow-off top, CMF turns negative and price drops back to the SMA50D and mid-range. Trigger: close below $56.20 (VWAP/EMA21) with a MACD histogram turning negative. Target: $54.80–$55.85. Invalidation: reclaim of $57.60 on rising volume. (20% probability)
PRICE TARGETS
- Target Price: $58.20 (27-day, about +1.8% from $57.16)
- Expected Range: $54.40 to $60.70. Width is $6.30, about 11% of the current price, which is consistent with a 27-day horizon and wider than any 2–14 day range.
- Key Levels: Support at $56.20 (VWAP/EMA21 zone, with deeper support at $55.85–$55.95), Resistance at $59.20 (Nov 4 reversal high, with the Bollinger upper band at $58.44 as interim resistance)
OVERALL BIAS
OVERALL BIAS: BULLISH - ADX of 32.7 with +DI far above −DI, a positive MACD crossover, a golden cross, and price above all key moving averages favor further upside. The Nov 4 reversal candle, fading CMF and cooling RSI argue for a choppy path under $59.20 rather than a straight-line advance.
This is educational analysis and not financial advice.