AAL 27-day bullish forecast — Nov 8, 2026
- Bias: Bullish
- Timeframe: 27 days (made Nov 8, 2026, target date Dec 4, 2026)
- Price at analysis: $13.18
- Price target: $13.80
- Expected range: $12.05 – $14.35
- Result: Pending — graded after the close on Dec 4, 2026
Get a free AI analysis of AAL today
Analysis
TECHNICAL INDICATORS
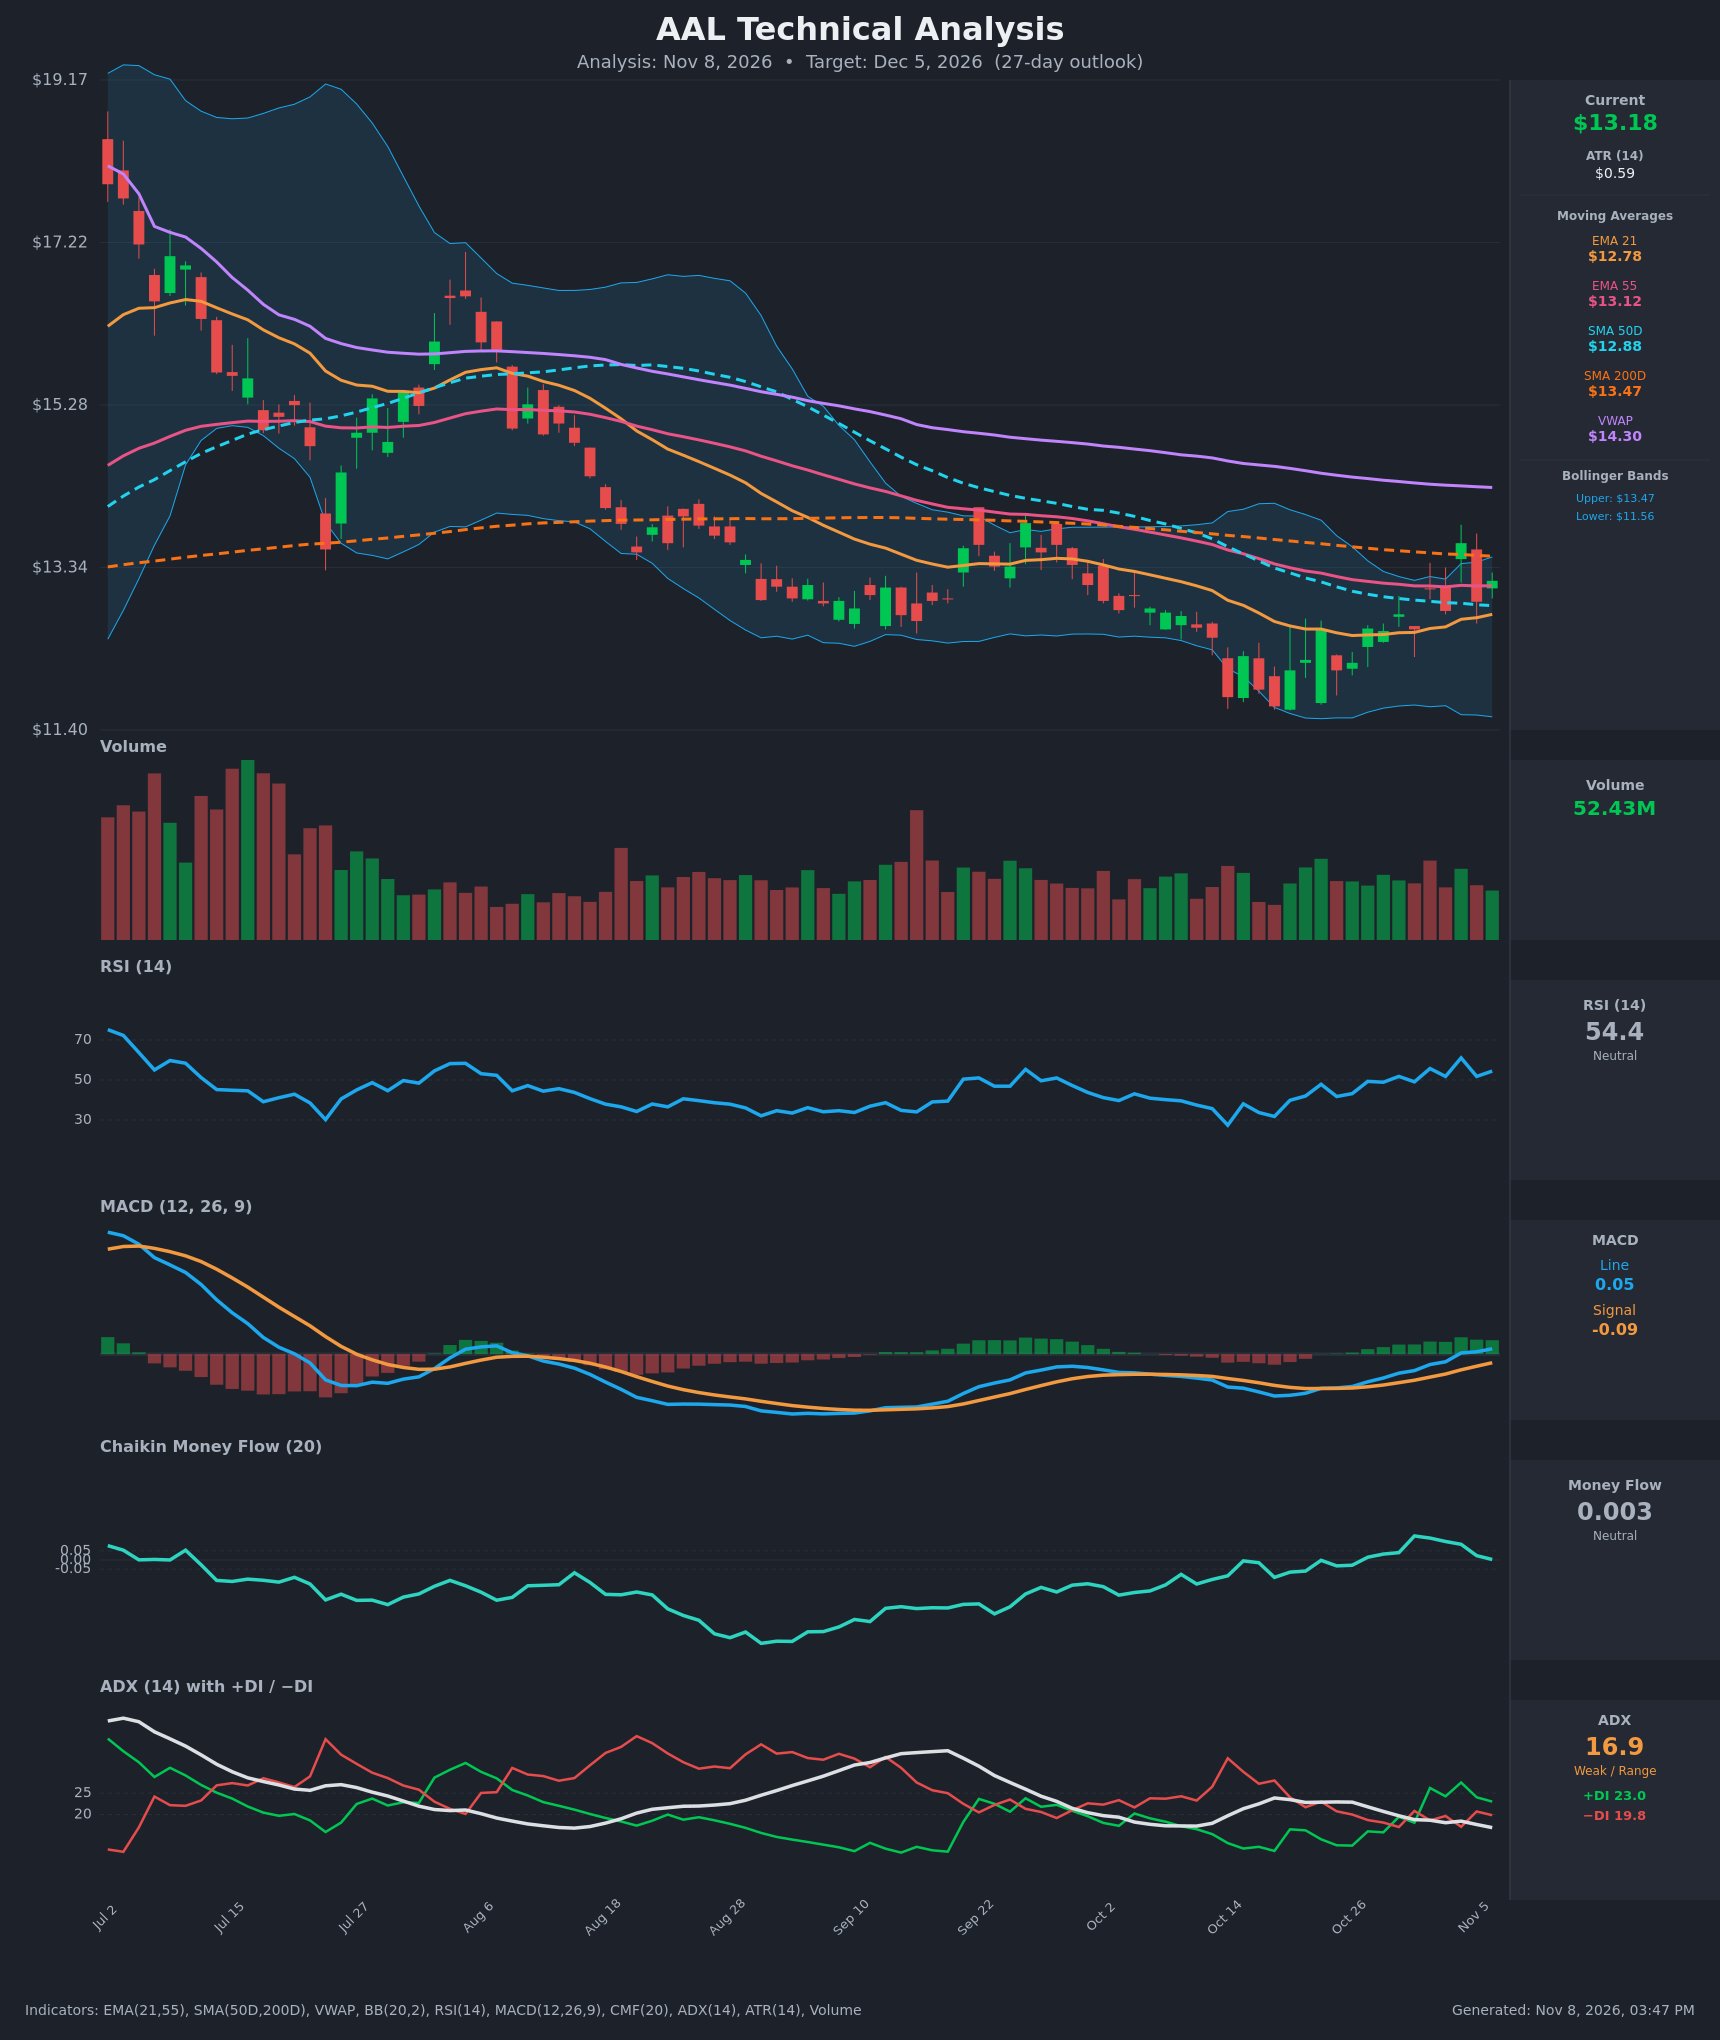
- RSI (14): 54.45, up from 31.8 on Oct 19 and now above the 50 midline. It is not near overbought (70). It is choppy (61 → 51.8 → 54.4 in the last three bars) but the trend is higher. [Bullish]
- 20 EMA (21 EMA): $12.78, with price at $13.18 above it. The EMA21 has turned up from $12.53, so it now acts as dynamic support. EMA21 is still below EMA55 ($13.12) but the gap has narrowed from about $0.69 to $0.34, so a bullish cross is approaching but has not happened. [Bullish]
- MACD: Line 0.0527 is above Signal -0.0857 and has moved above zero. The bullish crossover occurred around Oct 22 and the histogram has been positive and widening since. The momentum shift is clear, though the line is still near zero. [Bullish]
- Bollinger Bands (20): Upper $13.47, lower $11.56, midline about $12.51. Price is in the upper half of the bands, just under the upper band, after rebounding from the lower band in mid-October. The bands are contracting, which fits a base. Upside is capped near $13.47 unless price makes a band walk or breakout. [Bullish]
- CMF (20): 0.003 sits in the neutral zone (±0.05). It has faded from its late-Oct peak of about 0.13, so buying pressure has cooled and there is no accumulation confirmation. [Neutral]
- ADX (14): 16.9 and falling, so the trend is weak or range-bound. +DI (23.0) is above −DI (19.8), a bullish tilt that began around Oct 29–Nov 2. The bears' earlier control (−DI 28 on Oct 19) has faded. [Weak Trend, Bullish lean]
- Volume: 52.43M, about average. Recent up days (the Oct 26-area bars and the Nov 4 spike to $13.63) had slightly better volume than the down days, but there is no breakout-level surge. [Neutral to mildly Bullish]
Other moving averages and VWAP:
- Price is below SMA200D ($13.475) and well below VWAP ($14.30), so the long-term trend is still down.
- Price is above SMA50D ($12.88) and EMA55 ($13.12).
- SMA50D is below SMA200D, a death-cross configuration that is still in force.
DIVERGENCES & TRENDS
- Bullish divergence (mid-Oct): Price made its low near $11.5 around Oct 14–19. RSI bottomed at 31.8 and has since recovered above 50, and MACD and +DI improved with it. Momentum has repaired faster than price.
- MACD: The bullish crossover on Oct 22 and the move above zero point to momentum turning up.
- RSI trend: The sequence of higher lows (31.8 → 41.8 → 49 → 51.8) is constructive.
- CMF: It has cooled from 0.13 to 0.003, a mild negative divergence against the recent price push toward $13.63. Buyers are not aggressively following through.
- ADX: At 16.9 and falling, it points to consolidation rather than a trending move.
- Crossovers and breaks:
- Price reclaimed EMA21, SMA50D and EMA55.
- The EMA21/EMA55 bullish cross is pending (gap about $0.34).
- Price is rejecting at the SMA200D/upper-band cluster around $13.47–13.63.
- Price remains below VWAP and SMA200D, so the larger downtrend from the $19 area is not yet broken.
CHART PATTERNS
- Bullish Falling Wedge / base (reversal): Since July, price has made lower highs and lower lows with contracting volatility, and the October low near $11.5 followed by higher lows resembles a wedge or rounding base. The textbook trigger is a close above the descending resistance, here the $13.47–13.63 zone (SMA200D, upper band and Nov 4 high). The measured move is a retest of $14.30 (VWAP), with an extended target near $15.
- Short-term consolidation range: Since late Oct, price has traded in a $12.1–13.6 range with weak ADX. It resembles a small ascending base (higher lows), a mild bullish tilt. A failure at $13.63 would turn it into a range or a lower-high rollover.
- Caveat: The long-term structure is still a downtrend (below SMA200D and VWAP, death cross in place), so this is an unconfirmed reversal and a breakout is needed.
POTENTIAL SCENARIOS
- Scenario 1: Bullish Breakout Above the SMA200D Cluster — Momentum (MACD above zero, RSI above 50, +DI > −DI) carries price through the $13.47–13.63 resistance, with an EMA21/EMA55 bullish cross confirming. Trigger: a daily close above $13.65 on rising volume. Target: $14.30 (VWAP), with a stretch to $14.50. Invalidation: a daily close below $12.78 (EMA21). (50% probability)
- Scenario 2: Bearish Rejection at Resistance — Price fails again at the $13.47–13.63 cluster, CMF turns negative, and price falls back below EMA21 and SMA50D, resuming the longer-term downtrend. Trigger: a close below $12.78 and the MACD histogram turning negative. Target: $12.00, then $11.55 (lower band and October low). Invalidation: a close above $13.65. (30% probability)
- Scenario 3: Neutral Range Consolidation — With ADX below 20 and CMF near zero, price chops between $12.60 and $13.55 through the period. Trigger: ADX stays below 20 with no close outside the range. Target: $12.90–13.30. Invalidation: a decisive close outside the $12.60–13.65 range. (20% probability)
PRICE TARGETS
- Target Price: $13.80 (27-day horizon, about +4.7%)
- Expected Range: $12.05 to $14.35 (width $2.30, about 17.4% of current price, in line with the 12–18% guidance for a 27-day window)
- Key Levels: Support at $12.78 (EMA21, with SMA50D at $12.88 just above it), Resistance at $13.47 (SMA200D and upper Bollinger Band; further resistance at $13.63 and $14.30 VWAP)
OVERALL BIAS
OVERALL BIAS: BULLISH - MACD is above its signal and zero, RSI has recovered above 50, price holds above EMA21, SMA50D and EMA55, and +DI leads −DI. This is a moderate-conviction call because ADX is weak, CMF is flat, and price still needs to clear SMA200D and VWAP resistance.
This is educational analysis and not financial advice.