AMD 34-day bearish forecast — Nov 8, 2026
- Bias: Bearish
- Timeframe: 34 days (made Nov 8, 2026, target date Dec 11, 2026)
- Price at analysis: $449.04
- Price target: $430.00
- Expected range: $370.00 – $510.00
- Result: Pending — graded after the close on Dec 11, 2026
Get a free AI analysis of AMD today
Analysis
TECHNICAL INDICATORS
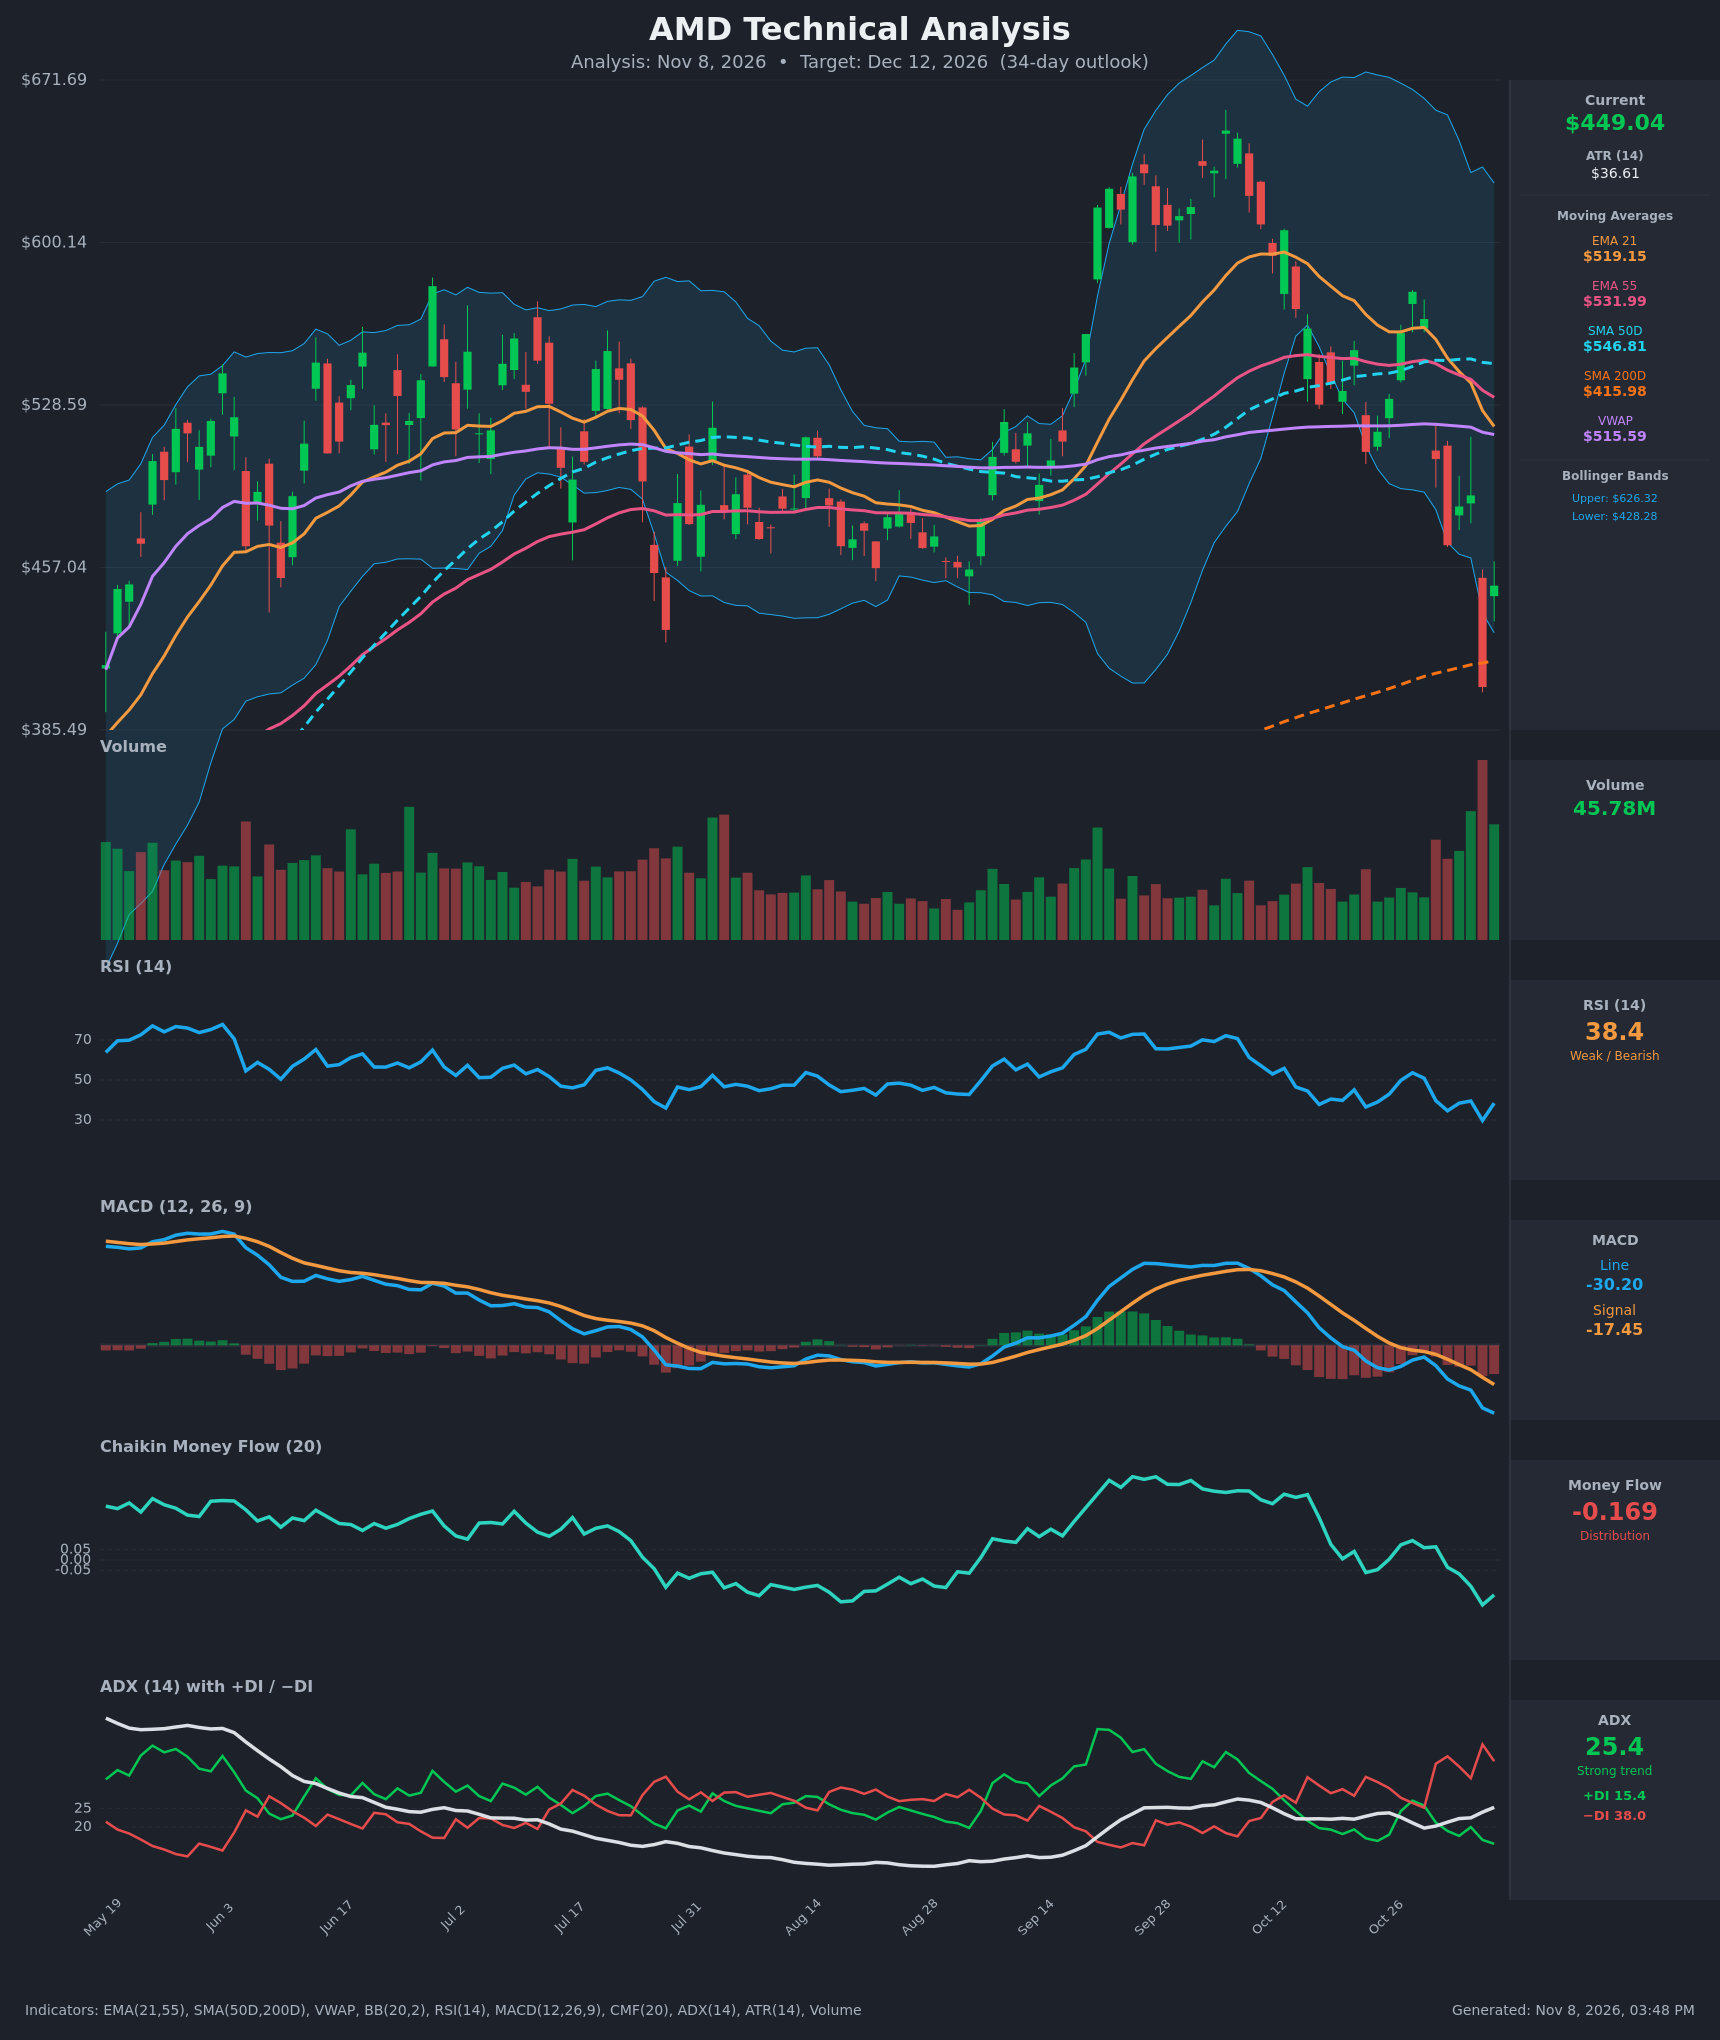
- RSI (14): 38.41, recovering slightly from a 29.7 oversold low on Nov 5. It sits below 50 and has made lower highs since the Oct 28 peak near 53.6, so momentum is bearish, with a possible oversold bounce. [Bearish]
- 20 EMA (EMA 21): $519.15. Price at $449.04 is about 13.5% below it, and the EMA is sloping down sharply from $580 on Oct 19. EMA 55 ($531.99) and SMA50D ($546.81) sit above as additional resistance. EMA21 is about to cross below EMA55, a bearish crossover. [Bearish]
- MACD: Line -30.20 is below signal -17.45, and the gap is widening (from -9.1 to -12.8 in the last two sessions). The histogram is deeply negative and expanding, and the line is making new lows. [Bearish]
- Bollinger Bands (20): Upper $626.32, lower $428.28, so the bands are very wide after the September spike. Price at $449.04 is in the lower quarter of the bands, having pierced the lower band at the $404 low on Nov 5. Price is back inside the band, which suggests a short-term bounce, but the trend remains down. [Bearish]
- CMF (20): -0.169, well below -0.05 and falling to a new low. It crossed negative in early November, which signals heavy distribution. [Distribution]
- ADX (14): 25.4 and rising, with -DI (38.0) far above +DI (15.4). This is a strong, established downtrend with bears firmly in control. [Strong Trend – Bearish]
- Volume: 45.78M on the latest bar. The Nov 5 breakdown candle (-17%) came on the highest volume in the chart window, so the selloff was heavily sold. The Nov 6 bounce came on lower but still elevated volume. [Bearish – distribution/capitulation-like]
DIVERGENCES & TRENDS
- No bullish divergence yet. RSI's Nov 5 low (29.7) came with price at $404, and the Nov 6 RSI of 38.4 is a relief bounce, not a divergence. MACD and CMF are both making new lows alongside price, so they confirm the downtrend.
- The EMA21/EMA55 bearish crossover is about to complete (EMA21 $519.15 vs EMA55 $531.99, gap closing quickly).
- Price fell below the lower Bollinger Band, SMA50D ($546.81) and EMA55, and is now approaching SMA200D ($415.98). That is the key long-term support, with the intraday low of about $404 slightly below it.
- SMA50D remains well above SMA200D, so there is no death cross. The long-term structure is still intact but being tested.
- VWAP ($515.59) is overhead, so price is trading well below the average volume-weighted level, which indicates sellers are in control.
CHART PATTERNS
- Bearish Rising Wedge / Expanding structure (September–October): The run from about $480 to $640 and the subsequent breakdown resembles a broad top. Lower highs after the Sep 28–Oct 5 peak, a failure at $578 on Oct 28, and the break below the $460–470 area confirm distribution.
- Possible Bearish Flag/Pennant: The Oct 26–Nov 4 consolidation between roughly $480 and $578 was followed by the sharp breakdown. A flag-type measured move would target the $400s, which has largely been met.
- Support test: SMA200D at ~$416 and the Nov 5 low at ~$404 form a support zone. A bounce toward $490–520 is plausible, but the broader pattern points to continued weakness or a choppy base.
POTENTIAL SCENARIOS
- Scenario 1: Bearish Continuation Below SMA200D — The strong downtrend (ADX 25.4, -DI 38) and distribution (CMF -0.169) push price through the $404 low and SMA200D. Trigger: daily close below $404. Target: $370–$390. Invalidation: close above $519 (EMA21). (45% probability)
- Scenario 2: Neutral/Bearish-Biased Relief Bounce, Then Fade — An oversold bounce toward EMA21/VWAP, then rejection and a drift lower to the $420s. Trigger: hold above $404 with RSI turning up. Target: bounce to $490–$520 first, then a fade to about $425–$440 by day 34. Invalidation: sustained close above $532 (EMA55). (35% probability)
- Scenario 3: Bullish Reversal from SMA200D — Capitulation volume marks a low. Price reclaims EMA21 and VWAP. Trigger: close above $490 with MACD histogram flattening. Target: $520–$545. Invalidation: close below $404. (20% probability)
PRICE TARGETS
- Target Price: $430.00 (34 days)
- Expected Range: $370.00 to $510.00 (width $140 = about 31% of current price, which is wider than the 12–18% guide for 30–60 days because ATR is $36.6 and volatility is extremely elevated. The range is anchored to roughly ±1.9 ATR-months, and the high end covers a relief rally to the EMA21 area.)
- Key Levels: Support at $404.00, Resistance at $519.00
OVERALL BIAS
OVERALL BIAS: BEARISH - Price is below all key moving averages with a strong downtrend (ADX 25.4, -DI 38 vs +DI 15.4), a widening bearish MACD gap, and CMF at -0.169 showing heavy distribution. SMA200D and the $404 low are the key supports, and while a relief bounce is likely, the path of least resistance remains lower.
This is educational analysis and not financial advice.