AAL 34-day bullish forecast — Nov 8, 2026
- Bias: Bullish
- Timeframe: 34 days (made Nov 8, 2026, target date Dec 11, 2026)
- Price at analysis: $13.18
- Price target: $13.70
- Expected range: $12.60 – $14.60
- Result: Pending — graded after the close on Dec 11, 2026
Get a free AI analysis of AAL today
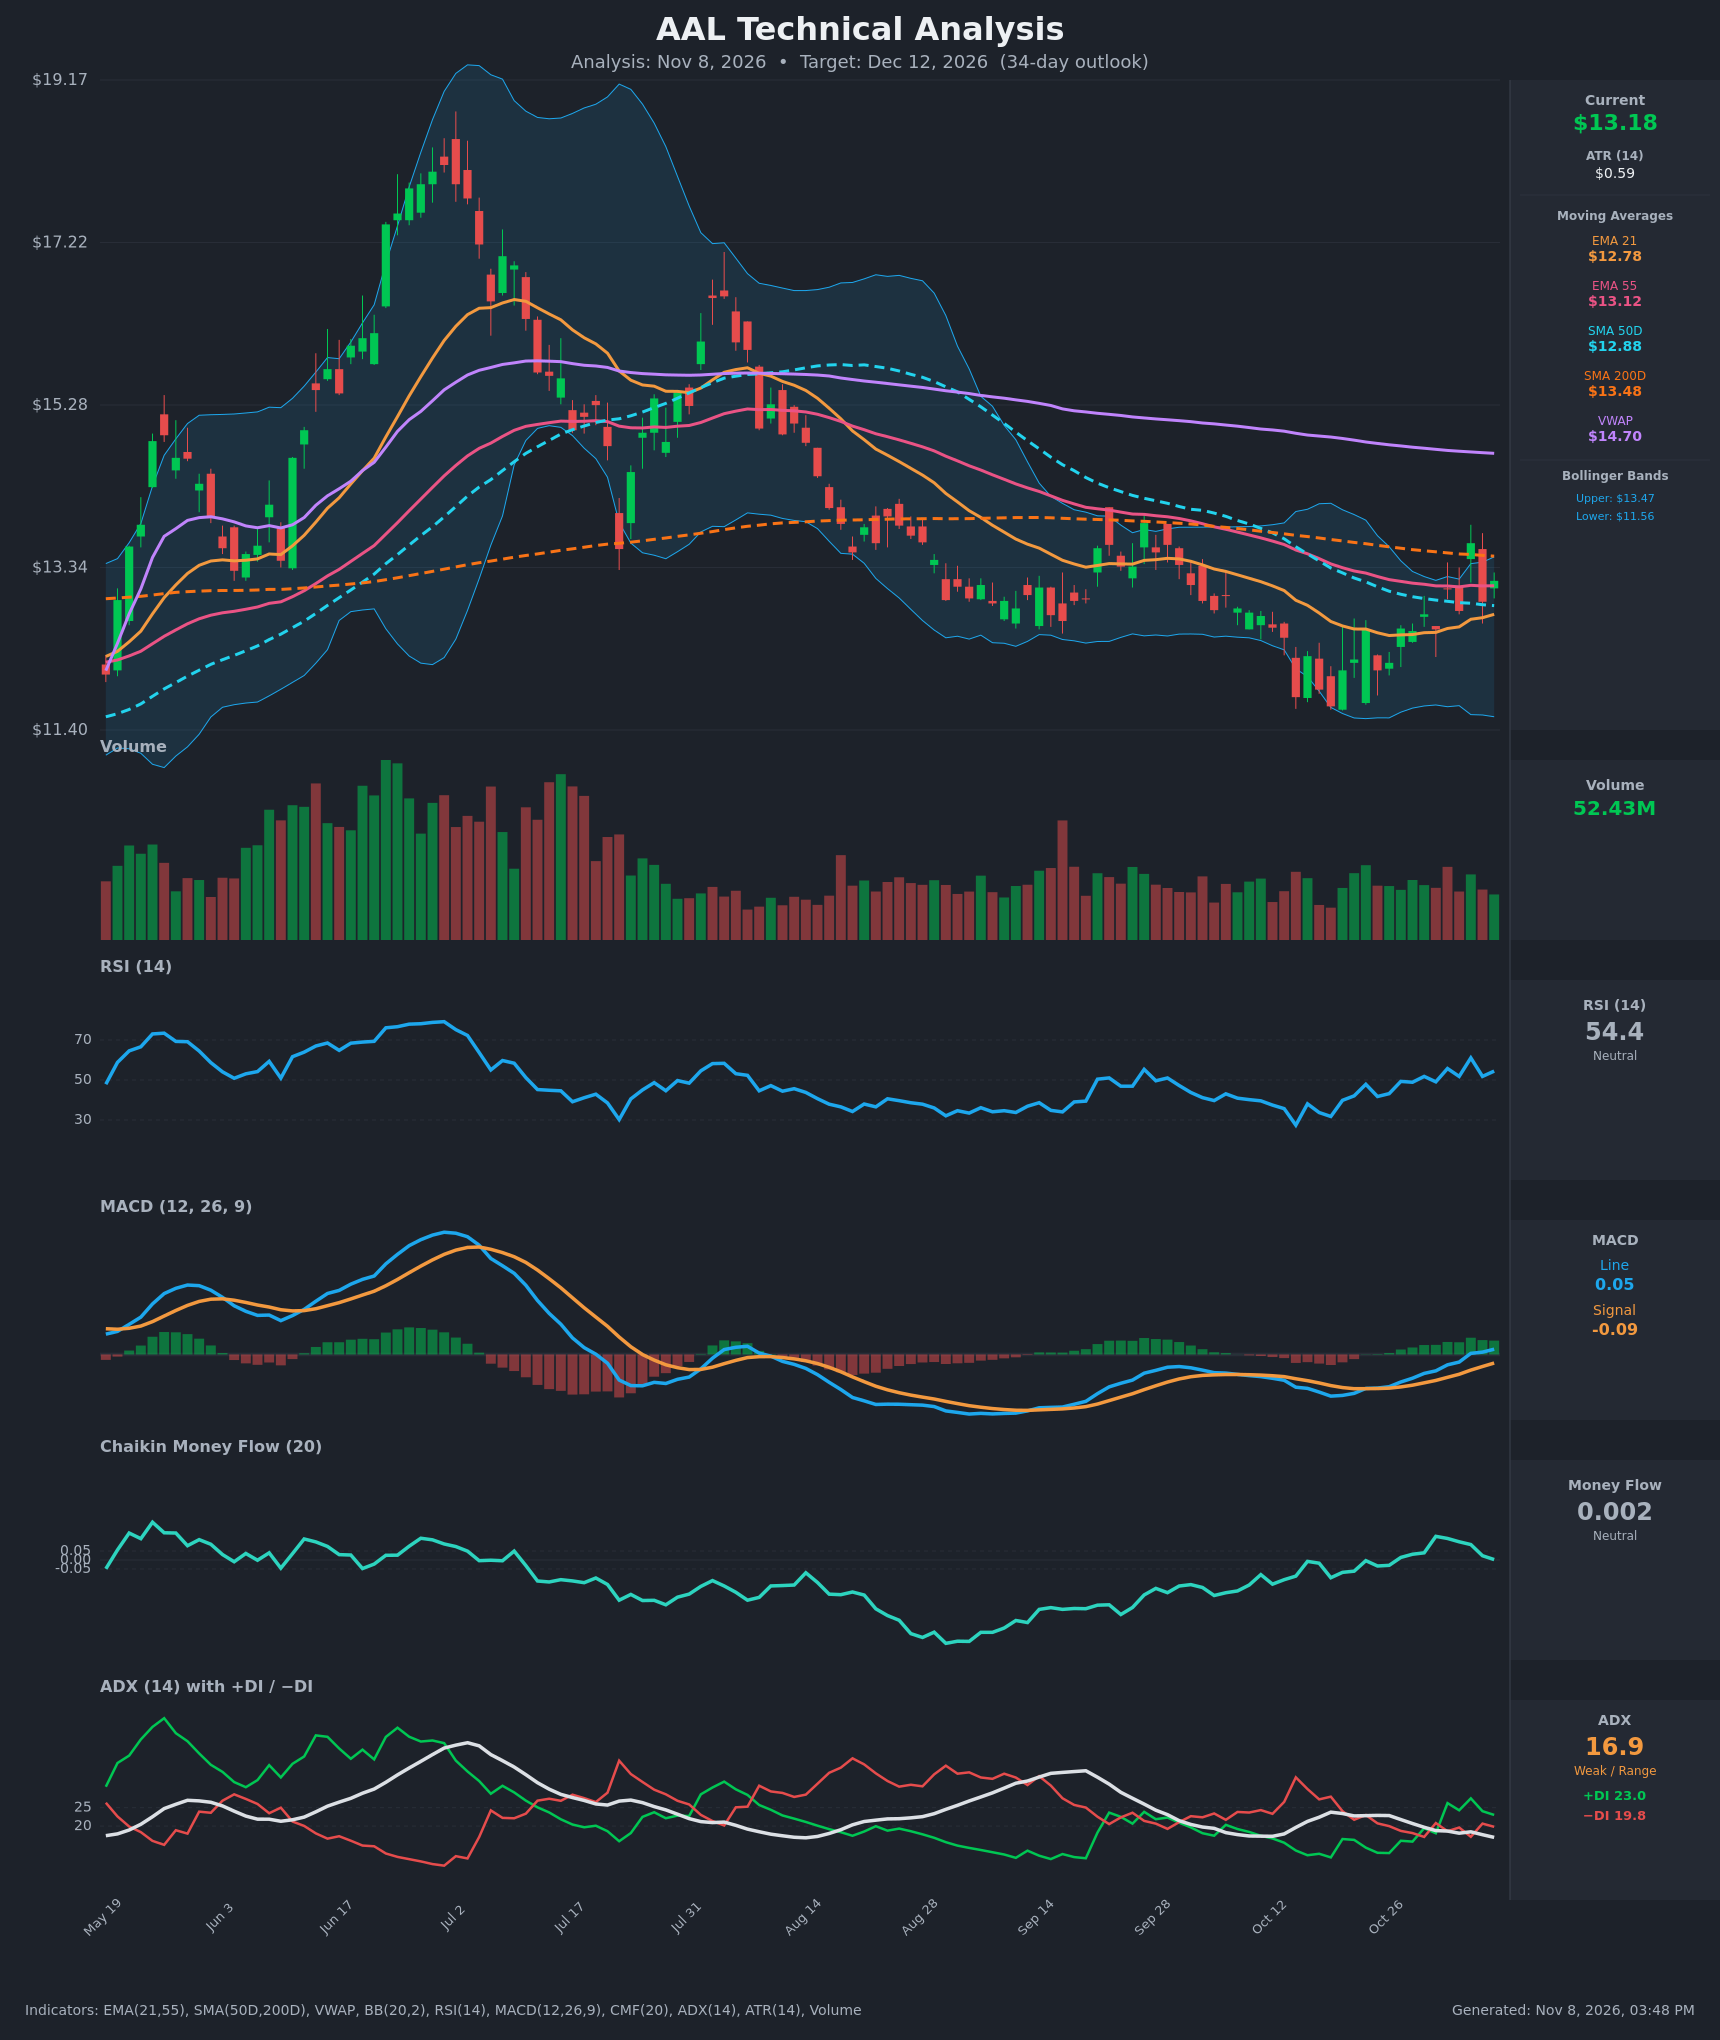
Analysis
TECHNICAL INDICATORS
- RSI (14): 54.45, up from an oversold-edge 31.8 on Oct 19. It has stabilised above 50 with a rising bias, but it is not overbought and has room to run. [Bullish]
- 20 EMA: The EMA 21 is $12.78 and price ($13.18) is above it, so it acts as support. The EMA 21 has turned up from $12.53. It remains below the EMA 55 ($13.12), though the gap has narrowed from about $0.65 to about $0.34. Price is roughly level with the EMA 55. [Bullish]
- MACD: The line (0.053) crossed above the signal (-0.086) and then above zero on Nov 4. The histogram is positive and expanding, which is a fresh bullish momentum shift. [Bullish]
- Bollinger Bands (20): Upper $13.47, lower $11.56, so price sits in the upper half of the bands, about $0.29 below the upper band. The bands are narrow compared with the June-July expansion, which means low volatility. Price is not yet pressing the upper band. [Neutral]
- CMF (20): 0.002, inside the ±0.05 neutral zone. It has faded from a peak of 0.13 on Oct 30, so buying pressure is flattening and there is no clear accumulation. [Neutral]
- ADX (14): 16.9 and falling, which means a weak or range-bound trend. +DI (23.0) is above −DI (19.8) after a bullish DI crossover on Oct 29/Nov 2, so the bulls have a slight edge but conviction is low. [Weak Trend – slight bullish tilt]
- Volume: 52.43M, average to below average, with no surge on the recent rebound. The Nov 4 spike to $13.63 was rejected the next day, so breakout confirmation is still missing. [Neutral – lacks confirmation]
DIVERGENCES & TRENDS
- Price made a lower low on Oct 19 ($11.68) while RSI and MACD have since built higher lows. This is a mild bullish momentum recovery, not a classic divergence.
- The MACD bullish crossover and the +DI/−DI crossover happened within the same week, and both are early signals.
- Price has reclaimed the EMA 21 and SMA 50D ($12.88). It is still below the SMA 200D ($13.48) and far below VWAP ($14.70). The SMA 50D is below the SMA 200D, so the death-cross regime persists. The longer-term downtrend from the June peak (~$18) is intact.
- Overhead resistance is stacked: the Nov 4 high of about $13.63, the SMA 200D at $13.48, and the upper Bollinger Band at $13.47. Failure here would reinforce the bearish long-term structure.
- ADX is weak (<20) and falling, so any breakout needs a volume and ADX pickup to be trusted.
CHART PATTERNS
- Bullish Double Bottom (tentative): Lows near $11.7 in mid-October (Oct 14 and Oct 19) with a neckline around $13.55–13.65. A confirmed close above $13.65 gives a measured target of roughly $13.65 + ($13.65 − $11.70) ≈ $15.60. This is not yet confirmed.
- Falling-wedge-like base: Lower highs and lows since August have compressed into a tightening range, with price now breaking above the descending EMA structure. This favours an upside resolution, but the SMA 200D is the immediate test.
- The sideways range of $11.7–$13.6 is also consistent with a Symmetrical Triangle or range, which is why conviction is moderate.
POTENTIAL SCENARIOS
- Scenario 1: Bullish Breakout Above the 200-Day — Momentum (MACD, DI, RSI) pushes price through the SMA 200D and the $13.63 swing high, completing the double bottom. Trigger: daily close above $13.65 on rising volume. Target: $14.50, with $14.70 (VWAP) as an extension. Invalidation: close back below $12.78 (EMA 21). (45% probability)
- Scenario 2: Neutral Range Chop — Price keeps oscillating below the SMA 200D and above the 50-day, given weak ADX and flat CMF. Trigger: repeated rejections near $13.50 with support holding at $12.78. Target: $12.70–$13.50. Invalidation: a close above $13.65 or below $12.50. (30% probability)
- Scenario 3: Bearish Rejection — Resistance at the SMA 200D and the Nov 4 high holds, the MACD rollover fails, and price retests the October lows. Trigger: close below $12.78, then below $12.50. Target: $11.70. Invalidation: close above $13.65. (25% probability)
PRICE TARGETS
- Target Price: $13.70 (34-day)
- Expected Range: $12.60 to $14.60. Width is $2.00, or about 15.2% of the current price, which fits the 12–18% guidance for 30–60 days.
- Key Levels: Support at $12.78 (EMA 21), with deeper support at $11.70. Resistance at $13.48 (SMA 200D), with a next hurdle at $13.65.
OVERALL BIAS
OVERALL BIAS: BULLISH - A fresh MACD bullish crossover above zero, +DI above −DI, rising RSI, and price reclaiming the EMA 21 and SMA 50D favour an upside test of the $13.48–$13.65 resistance zone. A tentative double-bottom adds to the case. Conviction is moderate because ADX is weak, volume is lacking, and price is still below the SMA 200D and VWAP.
This is educational analysis and not financial advice.