AMD 27-day bearish forecast — Nov 8, 2026
- Bias: Bearish
- Timeframe: 27 days (made Nov 8, 2026, target date Dec 4, 2026)
- Price at analysis: $449.04
- Price target: $432.00
- Expected range: $400.00 – $458.00
- Result: Pending — graded after the close on Dec 4, 2026
Get a free AI analysis of AMD today
Analysis
TECHNICAL INDICATORS
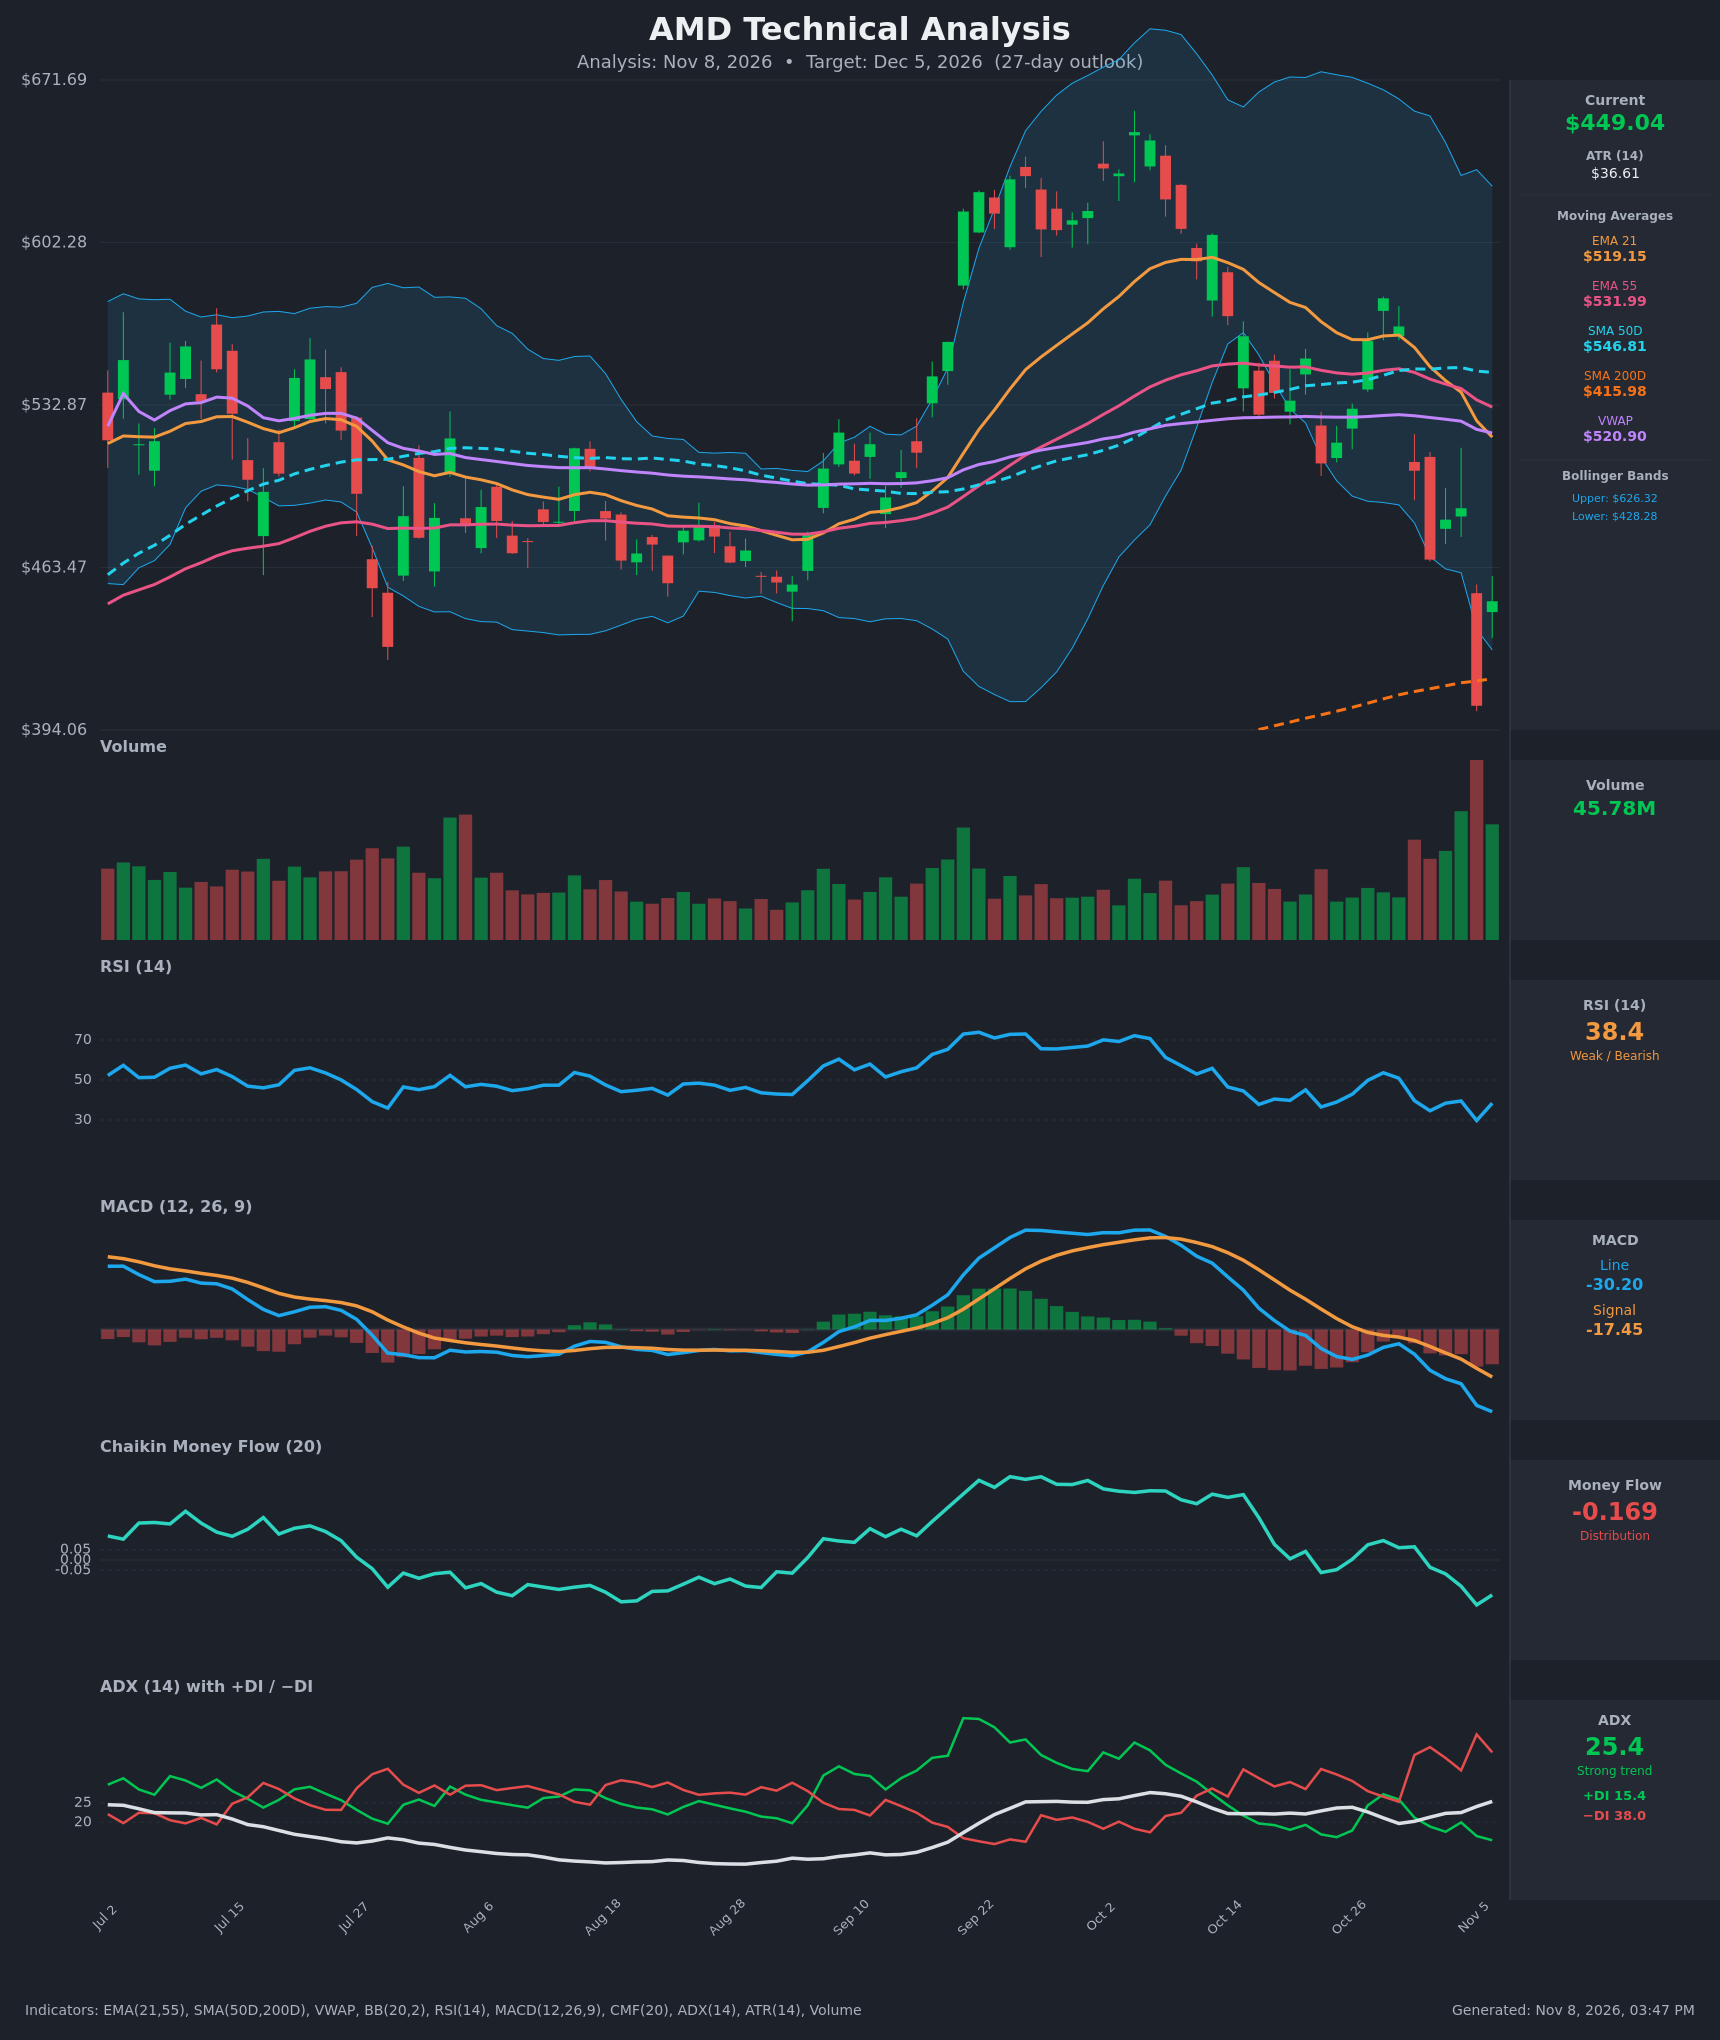
- RSI (14): 38.4, up from 29.7 on Nov 5 (oversold) and still below 50. The bounce is a relief move, and RSI has made lower highs since the Oct 28 reading of 53.6. [Bearish]
- 20 EMA: The 21 EMA is $519.15 and price ($449.04) is about 13.5% below it, so it acts as overhead resistance. The EMA21 also crossed below the EMA55 ($531.99) around Nov 4, a bearish crossover. [Bearish]
- MACD: The line is -30.20 against a signal of -17.45, a widening negative gap. The histogram is deeply negative and still expanding, with no sign of a bullish cross. [Bearish]
- Bollinger Bands (20): Upper band $626.32, lower $428.28. Price closed $404.40 on Nov 5, well below the lower band, then snapped back to $449.04, just above it. Bands are wide after the Sep–Oct volatility spike. The move shows a capitulation flush, but price is still in the lower quarter of the band. Mean reversion is possible, but a trending market can "walk the band". [Bearish]
- CMF (20): -0.169, well below -0.05 and near the cycle low. Distribution has been sustained since late October, and the rebound has not turned it around. [Distribution]
- ADX (14): 25.4 and rising, so a strong trend is forming. −DI (38.0) is far above +DI (15.4), a spread of about 22 points, so bears are firmly in control. [Strong Trend – Bearish]
- Volume: 45.78M on the bounce day. Volume has been elevated on the Nov 5 breakdown, which was the heaviest bar in the window. High-volume selling followed by a lower-conviction bounce looks like a capitulation test, not a confirmed reversal. [Bearish / Climactic selling, unconfirmed bounce]
DIVERGENCES & TRENDS
- No bullish RSI/price divergence is confirmed yet. RSI made a higher low (29.7 on Nov 5, against 34.6 on Nov 2 and 36.5 on Oct 22), but price made a lower low, so this is only a tentative, unconfirmed signal.
- MACD and price are both making lower lows, which confirms the downtrend.
- Price is below the EMA21, EMA55, SMA50D ($546.81) and VWAP ($520.90). It sits about 8% above the rising SMA200D ($415.98), which is the main long-term support.
- The EMA21 crossed under the EMA55, and the SMA50D has rolled over from its recent peak. There is no death cross, since the SMA50D is still well above the SMA200D, but the gap is narrowing.
- CMF fell from strongly positive (Sep) to deeply negative, a clear shift from accumulation to distribution.
- ADX is rising with −DI dominant, so trend strength supports the downside.
CHART PATTERNS
- Failed breakout / Double-Top-like structure: The Sep–Oct spike to about $660 faded into lower highs ($578, $566), then broke the $500–$520 support zone. This resembles a Bearish Head and Shoulders / Double Top, with the base of the range around $463–$500 as the neckline. The decline has already broken it.
- Bearish continuation: The measured move of the failed run-up points toward the SMA200D area ($416) and possibly lower.
- Bounce context: The Nov 5 flush and Nov 6 rebound could set up a Bullish Double Bottom only if price reclaims about $489 and holds. That has not happened.
- Targets: First downside target is $416–$428. A break below it opens the $400–$405 zone (the Nov 5 low). The upside relief target is the $489–$520 resistance cluster.
POTENTIAL SCENARIOS
- Scenario 1: Bearish Retest and Grind Lower — The relief bounce fades beneath the falling EMAs and price retests the Nov 5 low area near the SMA200D, with −DI dominance and distribution continuing. Trigger: rejection at $470–$489 or a close back below $428. Target: $416, then $400–$405. Invalidation: daily close above $489 with MACD histogram turning up. (50% probability)
- Scenario 2: Bullish Oversold Rebound — Capitulation volume marks a low, and price mean-reverts toward the EMA21/VWAP zone. Trigger: close above $489 on rising volume with CMF turning above 0. Target: $519–$530. Invalidation: loss of $404 (the Nov 5 low). (35% probability)
- Scenario 3: Neutral Base Between SMA200D and the Gap — Price chops between the $416 SMA200D and $489 resistance as selling exhausts. Trigger: failure of both the retest and the breakout, with ADX rolling over. Target: $430–$475. Invalidation: close outside $404–$500. (15% probability)
PRICE TARGETS
Range width check: $458 − $400 = $58, or 12.9% of $449.04. That is appropriate for a 27-day horizon, between the 14–21 day (8–12%) and 30–60 day (12–18%) guidance.
- Target Price: $432.00 (27 days, Dec 5, 2026)
- Expected Range: $400.00 to $458.00
- Key Levels: Support at $415.98 (SMA200D), Resistance at $488.78
OVERALL BIAS
OVERALL BIAS: BEARISH - Price is below every short- and mid-term average. MACD is negative and widening, CMF shows heavy distribution, and −DI dominates with ADX rising through 25. The post-flush bounce is likely to meet resistance well below the EMA21, with the SMA200D near $416 as the likely retest area. The oversold bounce is the main risk to this view.
This is educational analysis and not financial advice.