AMZN 27-day bullish forecast — Nov 8, 2026
- Bias: Bullish
- Timeframe: 27 days (made Nov 8, 2026, target date Dec 4, 2026)
- Price at analysis: $259.30
- Price target: $264.00
- Expected range: $243.00 – $281.00
- Result: Pending — graded after the close on Dec 4, 2026
Get a free AI analysis of AMZN today
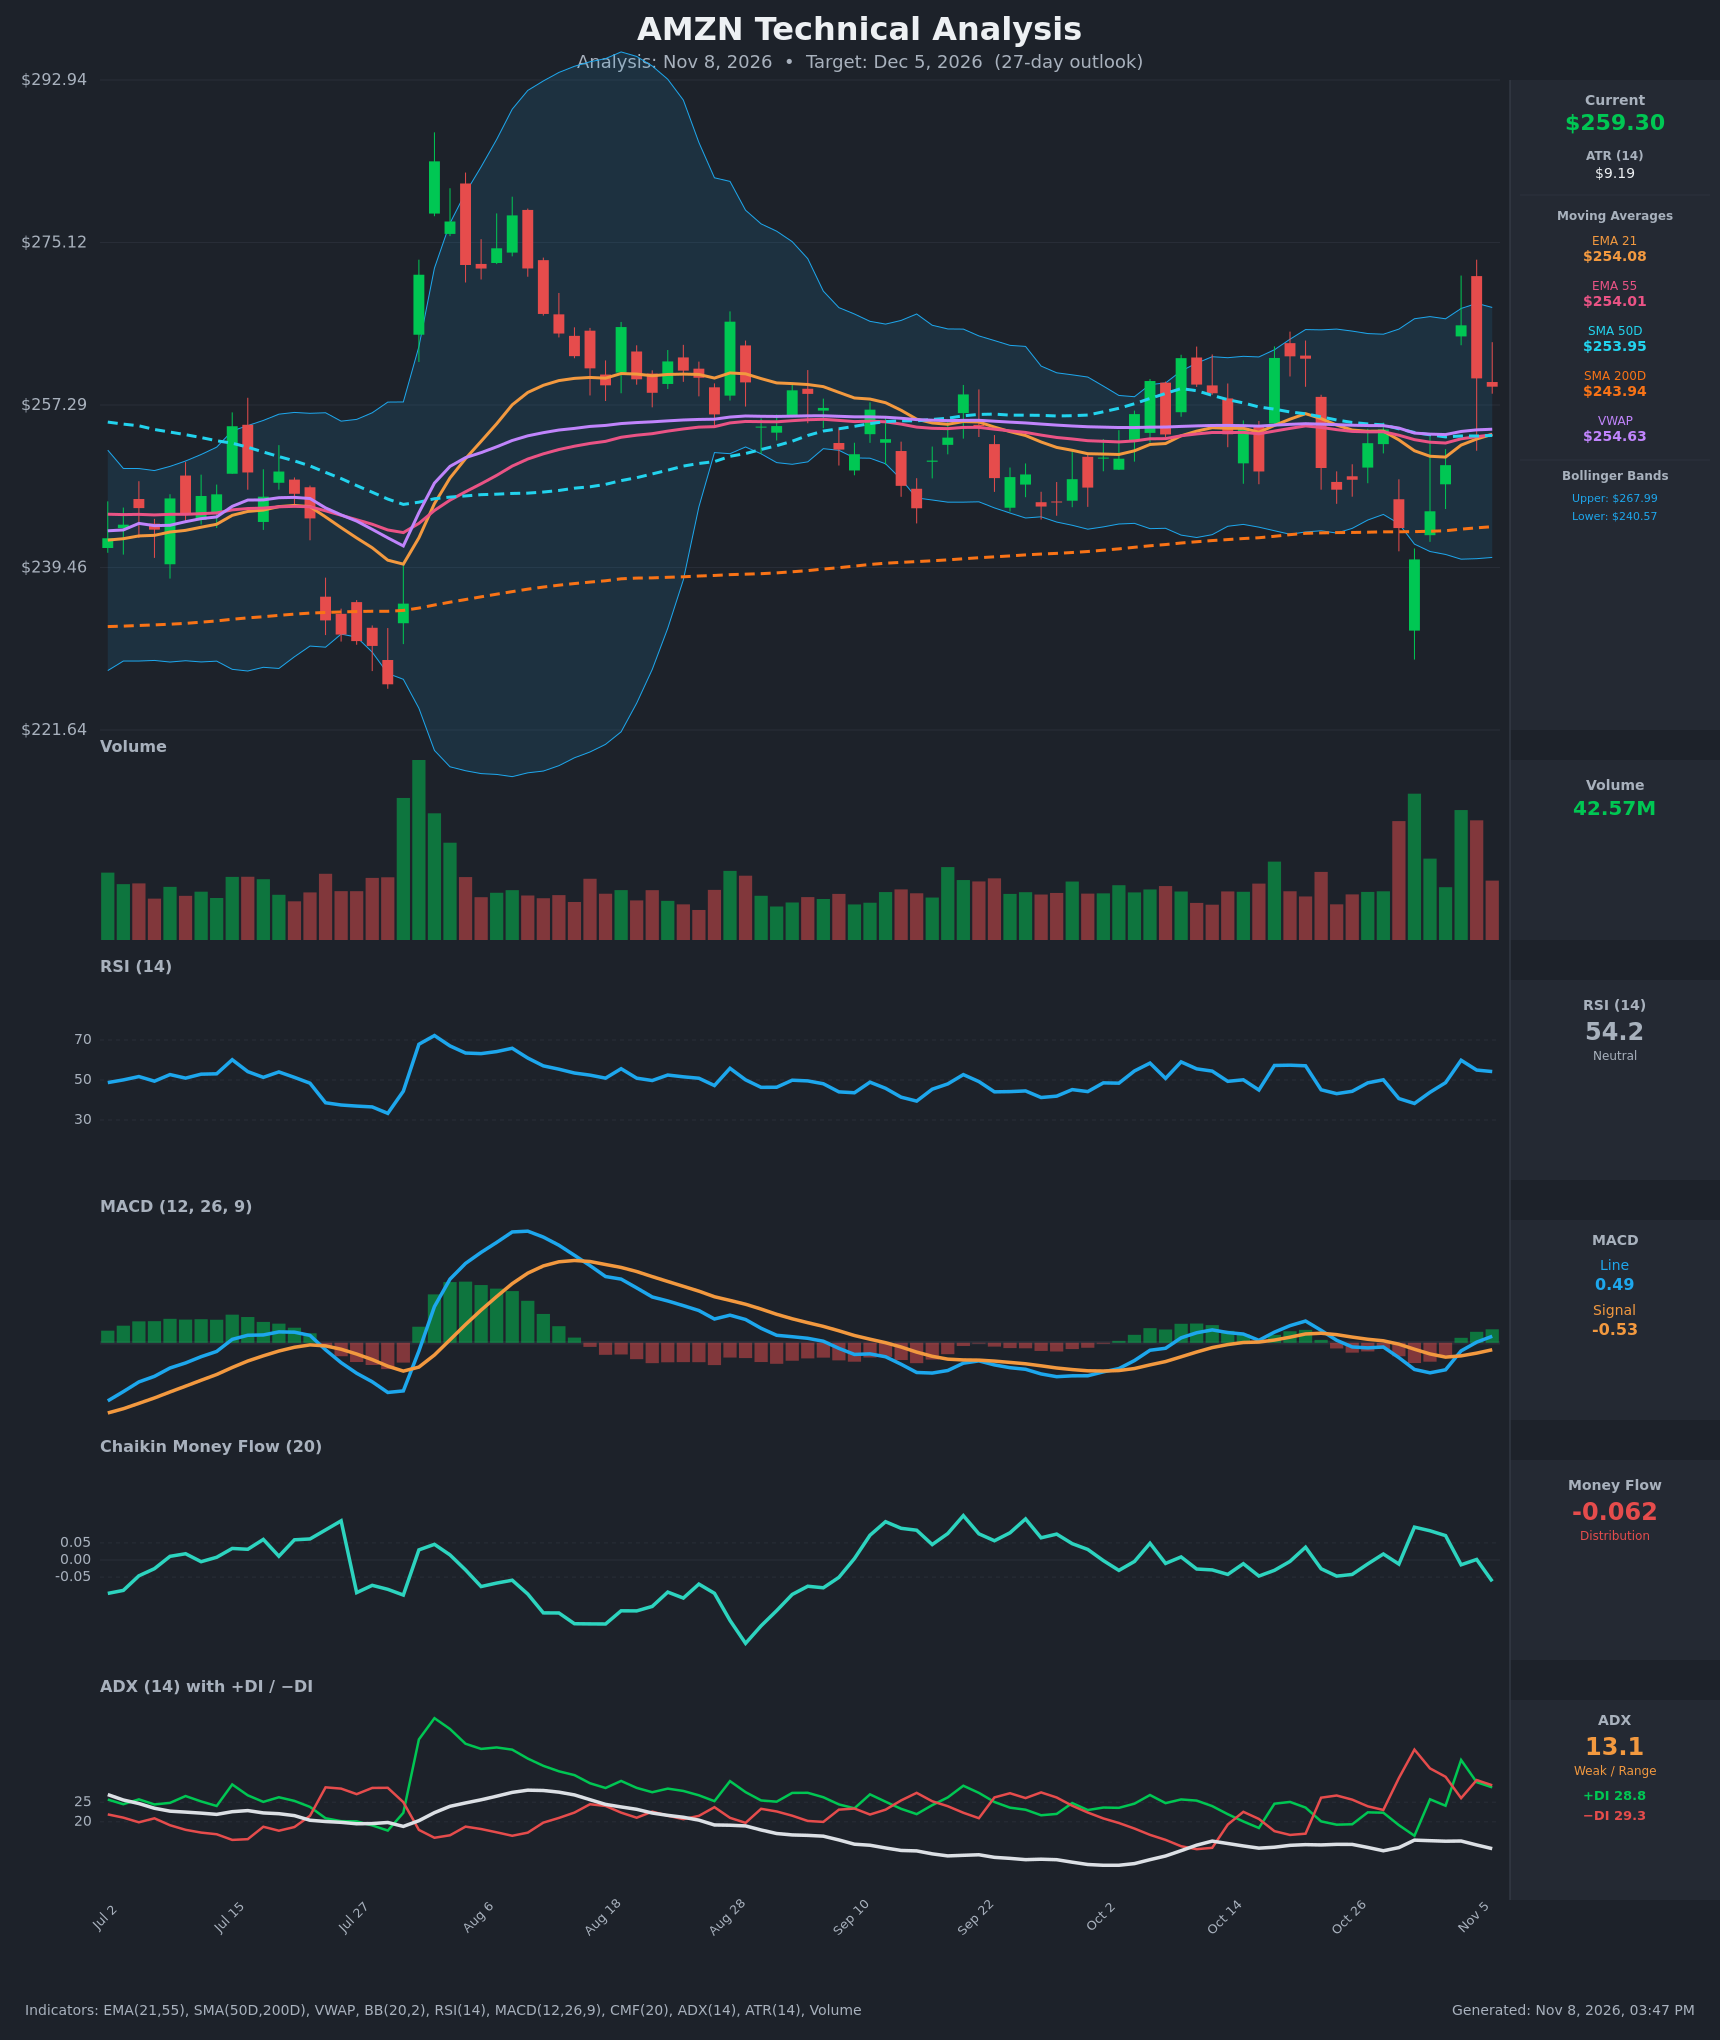
Analysis
TECHNICAL INDICATORS
- RSI (14): 54.22, near the midpoint. It spiked to 59.9 on the Nov 4 gap-up and has eased back over two sessions. It is neutral with slightly fading momentum, and there is no overbought or oversold condition. [Neutral]
- 20 EMA: The EMA 21 is $254.08 and price at $259.30 is about 2% above it. EMA 21 has just crossed back above EMA 55 ($254.01) after dipping below it, so the two are tightly braided. The $254 cluster (EMA 21/55, SMA50 $253.95, VWAP $254.63) is the first major support. [Bullish]
- MACD: The line (0.49) crossed above the signal (-0.53) and just moved above zero. The histogram is positive and expanding, from about -1.1 to about +1.0 over the last 5 bars. This is a fresh bullish crossover, but with a shallow amplitude, so it is a low-conviction signal. [Bullish]
- Bollinger Bands (20): The upper band is $267.99, the lower is $240.57 and the midline is about $254.3. Price sits in the upper half of the bands, below the upper band. The bands are moderately narrow compared with the July-August expansion, which points to range conditions. The Nov 4 spike failed near the upper band. [Neutral]
- CMF (20): -0.062, just below the -0.05 threshold. It has rolled over from +0.096 on Oct 30 and shows mild distribution. Price has bounced while money flow has not confirmed it. [Distribution]
- ADX (14): 13.1, which is weak and range-bound. -DI (29.3) is only marginally above +DI (28.8) after +DI led on Nov 4. The two are essentially tied, so neither side controls the market. [Weak Trend – no clear direction]
- Volume: 42.57M on the latest bar, elevated relative to the quiet September average. Heavy volume came on both the Oct 22 drop and the Nov 4 spike. The bars are mixed red and green, which suggests two-way participation and a volatile range rather than a clean trend. [Neutral/Volatile]
DIVERGENCES & TRENDS
- Moving averages: Price is above SMA200D ($243.94), so the long-term trend is up. SMA50D ($253.95) is above SMA200D, so there is no death cross. The EMA 21/55/SMA50 cluster is flat and compressed, which means no trend has been established.
- CMF vs price: Price bounced from $240 to $259–266, but CMF dropped from +0.096 to -0.062. This is a mild bearish divergence, and it makes the rally less trustworthy.
- MACD vs ADX: The MACD bullish cross is not backed by trend strength (ADX 13, falling since Oct). Signals of this kind are prone to whipsaw in a range.
- MACD vs the last bars: Price has slipped from $266 to $259.30 over the last 2 bars while the MACD histogram keeps rising. This is lagging and not a true divergence.
- Crossovers: MACD bullish crossover on Nov 5. The EMA 21/55 re-cross is positive. +DI/−DI are nearly crossing, and the Oct 29 –DI spike has been mostly reversed.
- Volatility: Wide swings (Oct 22, Oct 29, Nov 4 daily moves of about 4–6%) with fast reversals are typical of a choppy, news-driven market. ATR is $9.19, about 3.5% of price.
CHART PATTERNS
- Rectangle/range: Since mid-August price has been contained between about $240 and $268 with weak ADX. This resembles the Triple Top/Triple Bottom range structure on the reference diagram.
- Possible Bullish Double Bottom: The wicks near $240 and below on Oct 29–30 and the rebound there form a double-bottom-like base. The neckline is about $266–268 (Nov 4 high and the upper Bollinger Band). A close above $268 on volume would project a measured move to about $290 (the roughly $26 pattern height added to the neckline). This is not confirmed yet.
- Failed breakout risk: The Nov 4 spike to about $272 intraday closed at $266 and was followed by a lower close. If price loses $254, this will read as a failed breakout and a Bearish Double Top attempt.
- Targets: Bullish breakout is $268, then $280–290. Breakdown is $254, then $243.9 (SMA200D), then $240.
POTENTIAL SCENARIOS
- Scenario 1: Bullish Range-Top Retest and Grind Higher — The MA cluster at $254 holds as support, the MACD cross carries momentum, and price retests the $266–268 band edge. Trigger: hold above $254 and a daily close above $266. Target: $265–$275, with an extension to $280 on a clean breakout. Invalidation: daily close below $253.9 (SMA50/EMA cluster). (45% probability)
- Scenario 2: Neutral Range Chop — Weak ADX keeps AMZN oscillating around the $254 MA cluster between $245 and $267, with the CMF distribution capping rallies. Trigger: failure to close above $268, with support held at $250–254. Target: $250–$262 at the end of the window. Invalidation: close above $268 or below $243. (30% probability)
- Scenario 3: Bearish Failed Breakout — CMF distribution and −DI gaining control lead to a break of the MA cluster and a retest of the lower range. Trigger: daily close below $253.9, with MACD back below its signal. Target: $244 (SMA200D), then $240. Invalidation: reclaim of $260 on volume. (25% probability)
PRICE TARGETS
- Target Price: $264.00 (27-day horizon)
- Expected Range: $243.00 to $281.00 (width $38, about 14.7% of the current price, in line with the 12–18% guidance for 27 days)
- Key Levels: Support at $254.00 (EMA/SMA50/VWAP cluster), Resistance at $268.00 (upper Bollinger Band / Nov 4 rejection zone)
OVERALL BIAS
OVERALL BIAS: BULLISH - Price is above every moving average and SMA200D, and a fresh MACD bullish crossover with a rising histogram supports a modest upward drift toward the $266–268 range top. Conviction is limited by weak ADX (13), CMF distribution and the Nov 4 rejection, so the gain is expected to be modest and choppy rather than a strong trend.
This is educational analysis and not financial advice.