AAPL 34-day bullish forecast — Nov 8, 2026
- Bias: Bullish
- Timeframe: 34 days (made Nov 8, 2026, target date Dec 11, 2026)
- Price at analysis: $342.37
- Price target: $351.00
- Expected range: $322.00 – $373.00
- Result: Pending — graded after the close on Dec 11, 2026
Get a free AI analysis of AAPL today
Analysis
TECHNICAL INDICATORS
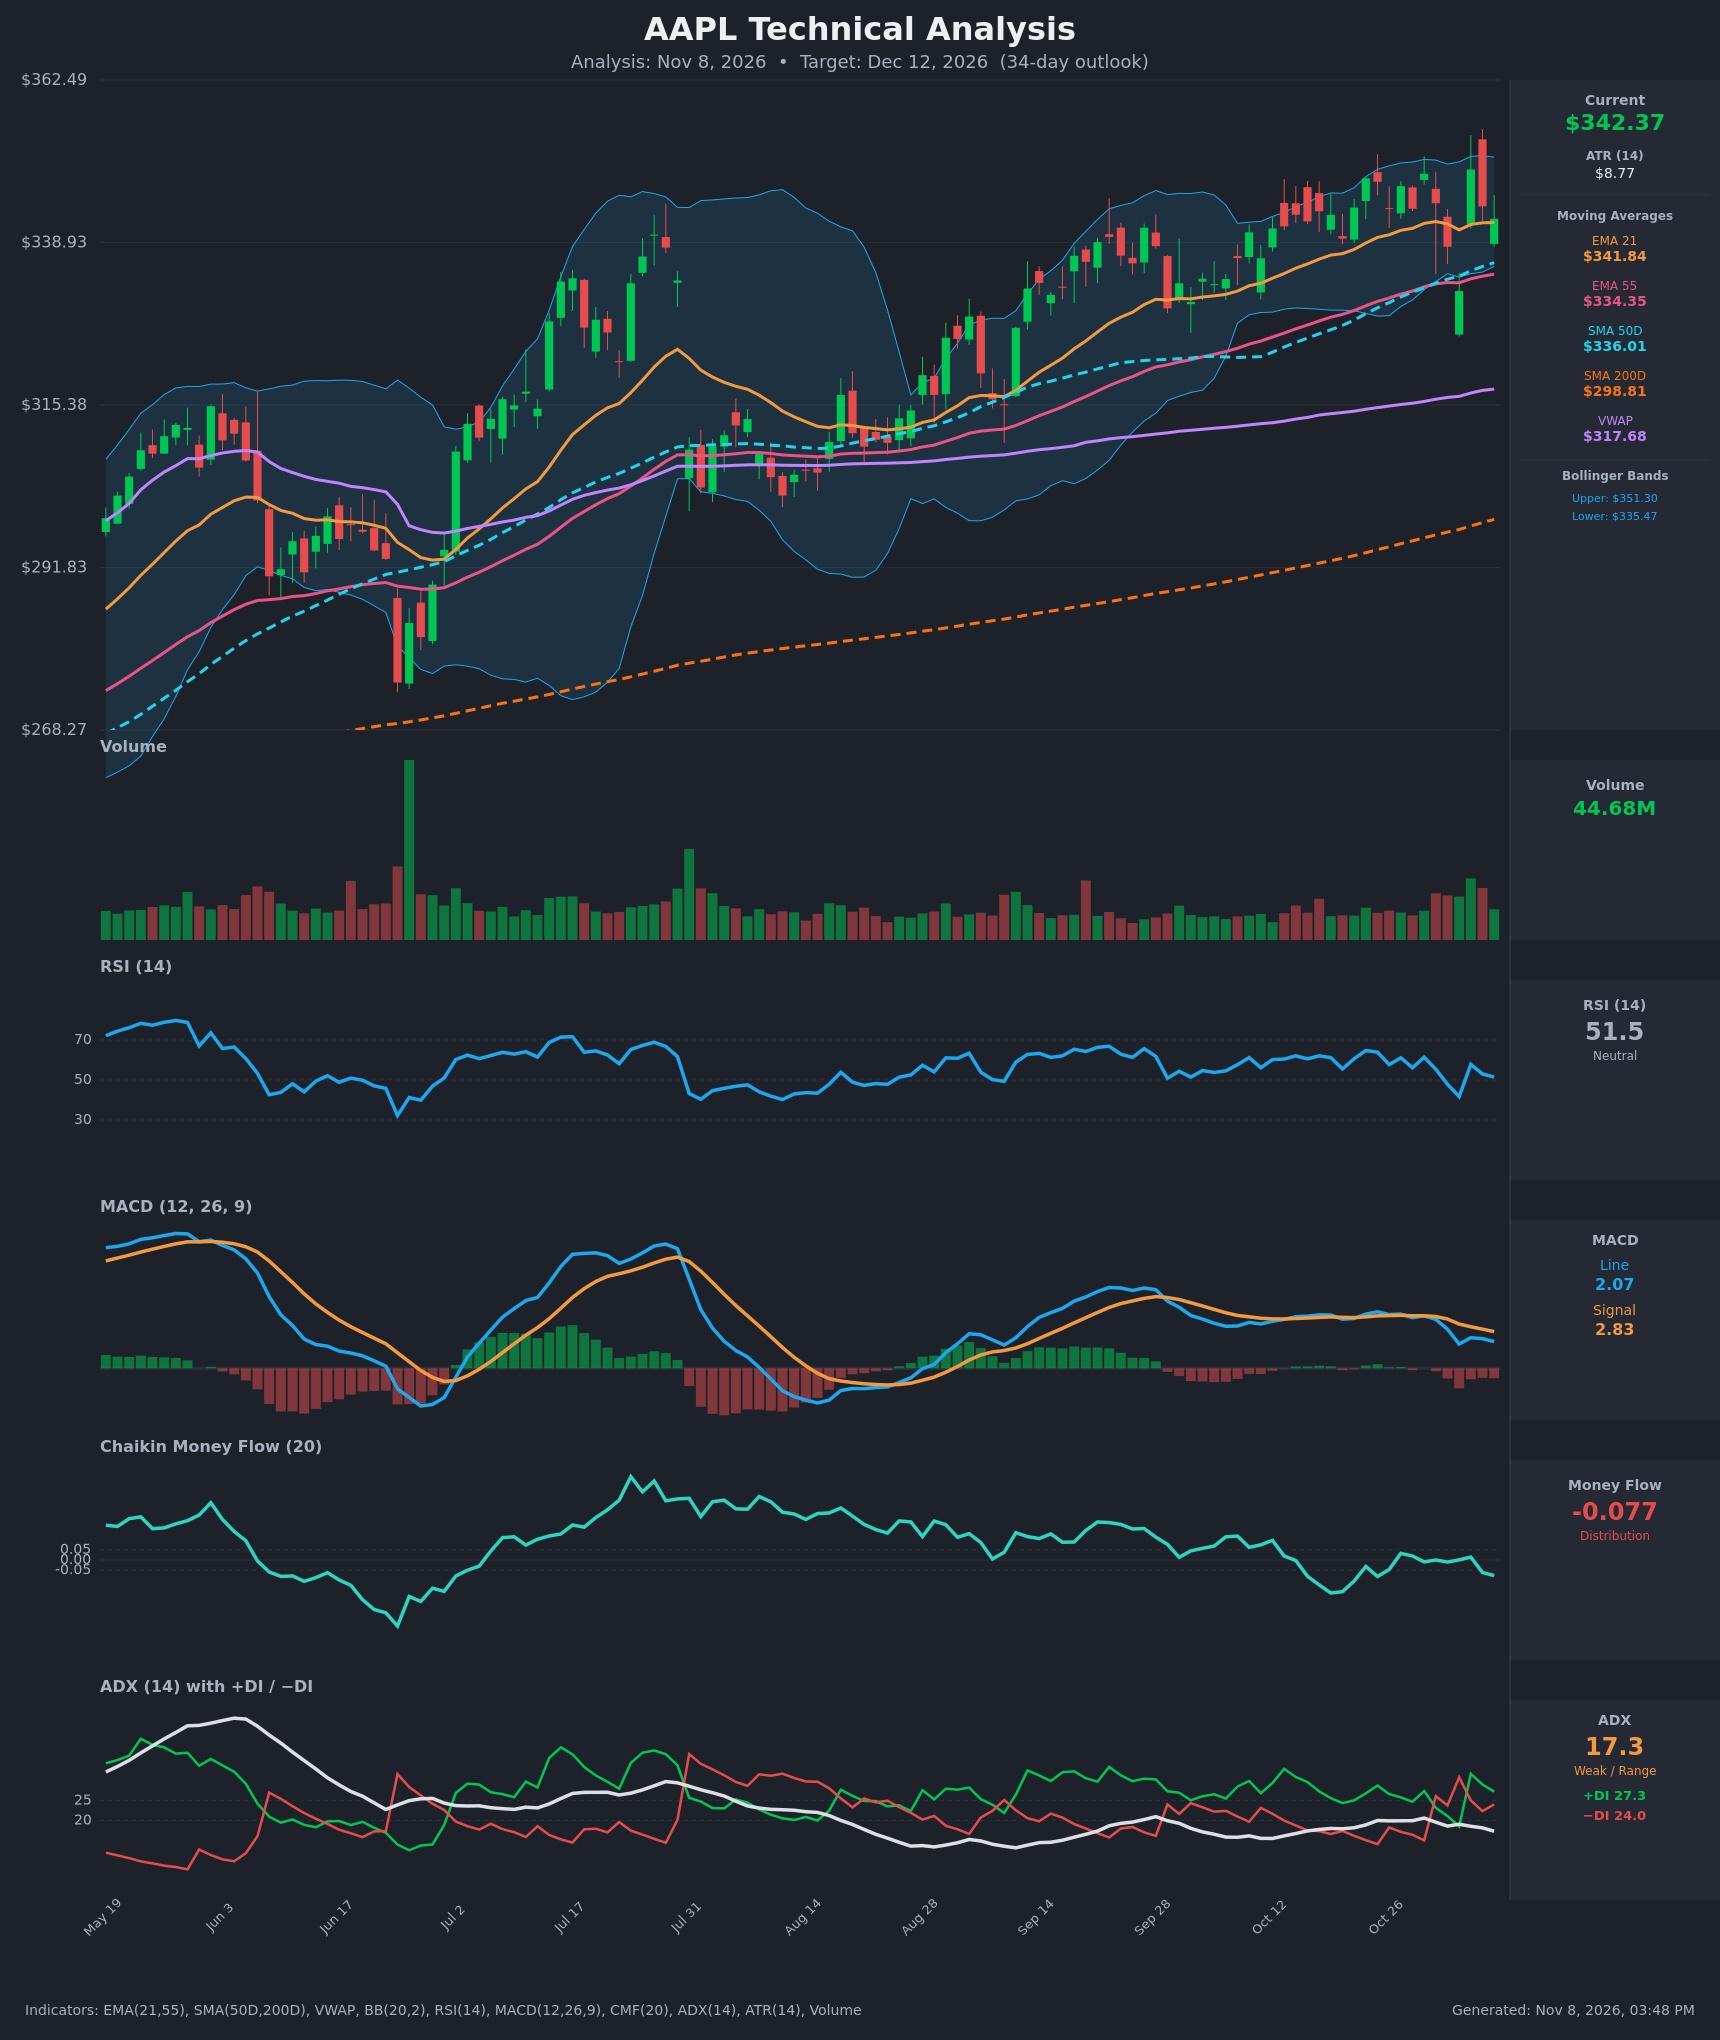
- RSI (14): 51.46, back at the midline after a sharp swing from 41.7 on Nov 3 to 57.8 on Nov 4. It has been drifting down from the 60s in late October, so momentum is fading without being oversold or overbought. [Neutral]
- 20 EMA (EMA 21): $341.84, with price at $342.37 just above it. The EMA is flat and price has been hugging it. EMA 21 is above EMA 55 ($334.35), so the intermediate trend is up, but there is no decisive support or resistance here. [Neutral]
- MACD: Line 2.07 is below the signal at 2.83, a bearish crossover that occurred around Oct 30 to Nov 2. The histogram is negative and widening (about -0.77), and both lines have rolled over from about 4.2. Momentum is clearly decelerating, though the lines are still above zero. [Bearish]
- Bollinger Bands (20): Upper $351.30, lower $335.47, mid-band about $343.4. Price sits at the middle of the bands, and the bands are fairly narrow, suggesting consolidation. The Nov 3 dip stayed just below the lower band and was bought immediately. [Neutral]
- CMF (20): -0.077, below the -0.05 threshold and falling after hovering near zero in late October. This shows mild distribution, with selling pressure on up moves. [Distribution]
- ADX (14): 17.3, below 20 and drifting lower, which means a weak or range-bound trend. +DI (27.3) is above −DI (24.0), so bulls hold a slim edge, but the gap narrowed after the Nov 3 flip (−DI 30.9 vs +DI 18.5). [Weak Trend, slight bullish lean]
- Volume: 44.68M, in line with the recent average and with no expansion. Volume was somewhat elevated on the red Nov 3 reversal day and on the Nov 4 recovery, but there are no breakout-sized bars either way. [Neutral – no conviction]
Moving average structure is solidly bullish:
- Price is above SMA200 ($298.81), SMA50 ($336.01), EMA 55 ($334.35) and VWAP ($317.68).
- SMA50 is far above SMA200, so the golden cross is long established.
- The 200-day is still rising.
DIVERGENCES & TRENDS
- Momentum divergence: Price is near its highs, around $342–349, but MACD (4.4 → 2.07) and CMF (zero → -0.077) are making lower highs. This is mild bearish divergence, and RSI has also failed to regain 65.
- Trend indicators: ADX at 17 shows the trend is stalling. DI spreads have narrowed and flipped briefly, which is typical of consolidation.
- Crossovers: MACD has crossed below its signal (bearish, short-term). EMA 21 remains above EMA 55 and SMA50 is above SMA200, so the larger structure is bullish. The EMA 21/55 spread is about $7.5 and has stopped widening.
- Reaction at support: The Nov 3 drop to $331.90 was recovered the next day (+5.3%). This is a bullish reaction at the cluster of SMA50, EMA 55 and the lower Bollinger Band.
- Long-term trend: The chart shows a series of higher swing lows since late July, with price walking up along the rising 50-day and 55-day averages.
CHART PATTERNS
- Consolidation range / possible Bearish Triple Top: Closes of $348.22, $348.91 and $349.51 (Oct 22, Oct 29 and Nov 4) show repeated rejection near $349–352. The "neckline" sits near $332–336, where the Nov 3 low and the SMA50/Bollinger lower band sit. A close below that zone would confirm a triple-top breakdown, with a measured move of roughly $15–17 to about $318–320.
- Rising channel / bullish flag alternative: Since August, price has climbed along the rising 21 EMA and 50 SMA. The current sideways drift looks more like a pause inside this channel than a clean reversal. A breakout above about $352 would resolve it upward, with a measured target near $365–370.
- Significance: Because ADX is below 20, the range is likely to persist for part of the window. The dominant long-term trend favors an upside resolution, but the triple-top risk is real.
POTENTIAL SCENARIOS
- Scenario 1: Bullish Range Breakout and Trend Resumption — The long-term uptrend reasserts itself. Buyers defend the $335–336 SMA50/lower-band zone and price pushes through the $349–352 ceiling as MACD re-crosses upward. Trigger: daily close above $352 on rising volume with MACD back above signal. Target: $362–368. Invalidation: close below $334 (EMA 55/SMA50). (45% probability)
- Scenario 2: Neutral Continued Consolidation — Price stays between about $332 and $352 with weak ADX, oscillating around the 21 EMA and ending near the middle of the range. Trigger: ADX stays below 20 and RSI stays between 40 and 60. Target: $338–348. Invalidation: a close outside $331–353. (25% probability)
- Scenario 3: Bearish Triple-Top Breakdown — Persistent distribution (CMF negative, MACD falling) leads to failure at the $349 ceiling and a break below the $332–336 support cluster. Trigger: daily close below $331.90 with MACD histogram expanding negatively. Target: $318–322 (a rising 200-day sits far lower at about $299). Invalidation: close back above $349. (30% probability)
PRICE TARGETS
For the 34-day horizon (to about Dec 12, 2026), the bullish scenario carries the most weight because of the intact long-term uptrend, but momentum and money-flow weakness limit conviction.
- Target Price: $351.00
- Expected Range: $322.00 to $373.00 (width $51 = about 14.9% of current price, consistent with the 30–60 day guideline of 12–18% and roughly 1 ATR-scaled move over 34 days)
- Key Levels: Support at $335.50 (SMA50 / lower Bollinger Band), Resistance at $352.00 (upper Bollinger Band / recent highs)
OVERALL BIAS
OVERALL BIAS: BULLISH - Price holds above every major moving average, the 50-day and 200-day averages are rising, and the Nov 3 dip was bought quickly at the SMA50/Bollinger lower-band cluster. This outweighs the bearish MACD cross and mild distribution on CMF. Conviction is modest because ADX is weak and a triple-top at $349 could trigger a pullback if $332 breaks.
This is educational analysis and not financial advice.