AMZN 34-day bullish forecast — Nov 8, 2026
- Bias: Bullish
- Timeframe: 34 days (made Nov 8, 2026, target date Dec 11, 2026)
- Price at analysis: $259.30
- Price target: $266.00
- Expected range: $243.00 – $281.00
- Result: Pending — graded after the close on Dec 11, 2026
Get a free AI analysis of AMZN today
Analysis
TECHNICAL INDICATORS
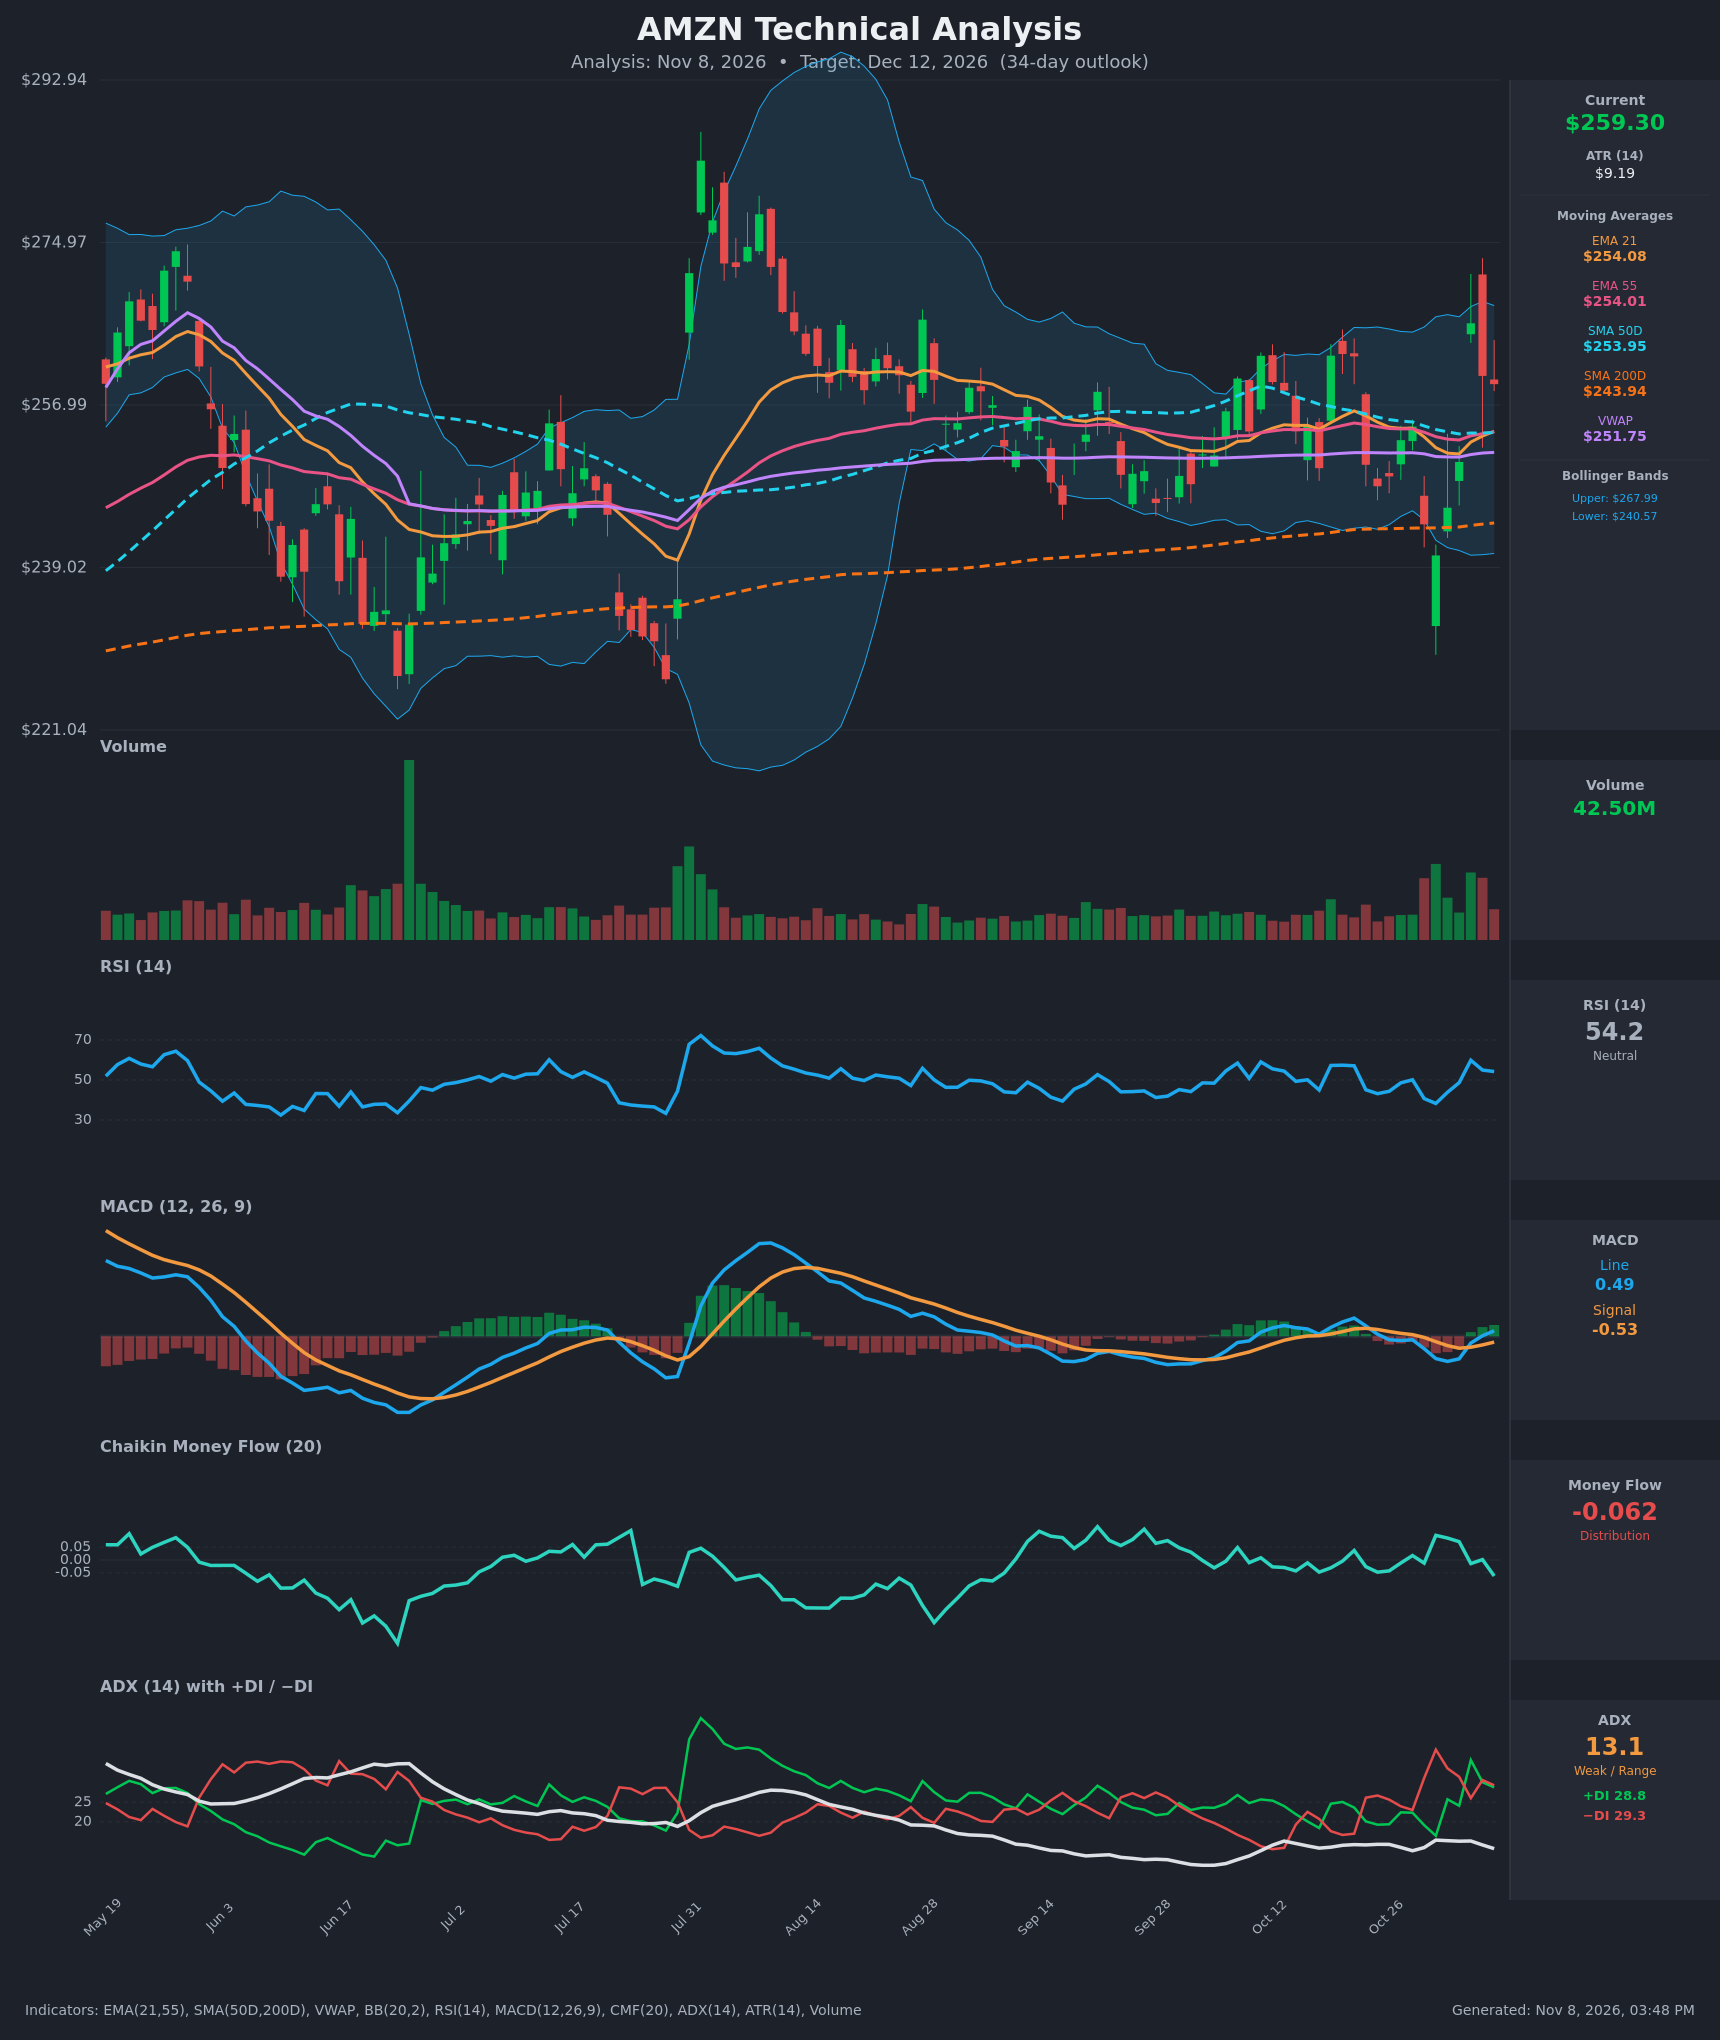
- RSI (14): 54.22, neutral. It has recovered from 38 on Oct 30 and peaked at 59.9 on Nov 4, but it is rolling over slightly (59.9 → 55.0 → 54.2). Momentum is stable and not stretched either way. [Neutral]
- 20 EMA (EMA 21): $254.08, with price at $259.30 above it. EMA 21 has just crossed back above EMA 55 ($254.01), and the EMA/SMA50 cluster at ~$254 is the first support. [Bullish]
- MACD: Line 0.493 is above Signal -0.526, a fresh bullish crossover on Nov 5 (line moved from -2.27 to +0.49). The histogram has turned positive and is rising, though the line is only just above zero. [Bullish]
- Bollinger Bands (20): Upper $267.99, lower $240.57, mid ~$254.3. Price sits in the upper half, about 0.7 of the band width. The bands are moderately narrow, so volatility is contained. The Nov 4 spike to ~$273 pierced the upper band and was sold, and the Oct 30 low tagged the lower band and bounced. [Neutral]
- CMF (20): -0.062, just below the -0.05 threshold. It slipped from slightly positive readings (+0.09 on Oct 30) back into mild distribution. That is a divergence against the price bounce. [Distribution]
- ADX (14): 13.1 with +DI 28.8 and −DI 29.3. This is a weak, range-bound market with no trend, and the DIs are essentially tied, with −DI marginally on top after +DI's spike to 35.8. [Weak Trend, no clear direction]
- Volume: 42.50M, around or slightly above the recent average. Volume was heavy on the big Oct 22 and Nov 4 to 5 swings but is not confirming a sustained directional move. The Nov 4 gap-up on high volume was partially reversed the next day. [Neutral / indecisive]
DIVERGENCES & TRENDS
- Price vs CMF: Price has bounced from $240 to $259 while CMF has fallen back into distribution. This is a mild bearish divergence that suggests the bounce lacks conviction.
- MACD: The bullish crossover happened from a deeply negative base, and the histogram is turning up. This is early-stage momentum improvement.
- Moving averages: EMA 21, EMA 55, SMA 50D and VWAP are all converging at $252–254, so price has been oscillating around a flat mean. SMA 200D ($243.94) is rising slowly beneath, which keeps the long-term trend intact (price above it). There is no golden or death cross, since SMA 50D has been above SMA 200D throughout.
- ADX: At 13 and falling from 15, it confirms a trendless, mean-reverting regime.
- Failure at highs: The Nov 4 spike to ~$273 and subsequent long red candle form a rejection near the top of the multi-month range.
CHART PATTERNS
- Dominant structure: Since early August, price has been in a rectangle-type consolidation between roughly $240 and $268–273. It resembles the "Bullish Triple Top/Bottom" range box in the reference, with repeated tests of both edges and a weak ADX.
- Support tests: The $240 area has been tested several times (late Sept/early Oct and Oct 30) and held above SMA 200D. This is a loose double/triple-bottom base, and a break above ~$268–273 would project toward ~$290 (range height of ~$30 added to the breakout).
- Resistance rejection: The Nov 4 spike and fade near $273 is a short-term reversal warning, so the upper edge is firm resistance.
- Significance: There is no clean breakout yet, and price is in the upper-middle of the range. Moves are likely to be choppy before a decisive break.
POTENTIAL SCENARIOS
- Scenario 1: Bullish Range Push and Breakout Attempt — Price holds the $254 moving-average cluster, MACD stays positive, and buyers retest the upper range. Trigger: daily close above $268 (the upper Bollinger Band) on rising volume. Target: $267–$273 initially, with extension to ~$280 on a clean breakout. Invalidation: daily close below $252. (45% probability)
- Scenario 2: Neutral Continued Chop — ADX stays below 20 and price oscillates around the $254 mean, between $245 and $268. Trigger: failure to break either $268 or $247. Target: $252–$262. Invalidation: close beyond $270 or below $243. (28% probability)
- Scenario 3: Bearish Rejection and Range Low Retest — CMF distribution persists, −DI retakes control, and price loses the $254 cluster. Trigger: daily close below $253 with MACD re-crossing below signal. Target: $244–$240 (SMA 200D and lower band). Invalidation: close above $264. (27% probability)
PRICE TARGETS
- Target Price: $266.00 (34-day horizon)
- Expected Range: $243.00 to $281.00. Width is $38, about 14.7% of the current price, consistent with the 30–60 day guidance of 12–18%.
- Key Levels: Support at $254.00 (EMA 21/55 and SMA 50D cluster), Resistance at $273.00 (recent spike high, just above the $267.99 upper Bollinger Band)
OVERALL BIAS
OVERALL BIAS: BULLISH - Price sits above all key moving averages, including a rising SMA 200D, and MACD has just crossed bullishly with a positive histogram. Repeated defenses of the $240 area support a modest upside drift toward the top of the range. Conviction is limited by weak ADX (13.1), CMF distribution and the rejection near $273.
This is educational analysis and not financial advice.