DELL 34-day bearish forecast — Nov 8, 2026
- Bias: Bearish
- Timeframe: 34 days (made Nov 8, 2026, target date Dec 11, 2026)
- Price at analysis: $328.53
- Price target: $308.00
- Expected range: $283.00 – $341.00
- Result: Pending — graded after the close on Dec 11, 2026
Get a free AI analysis of DELL today
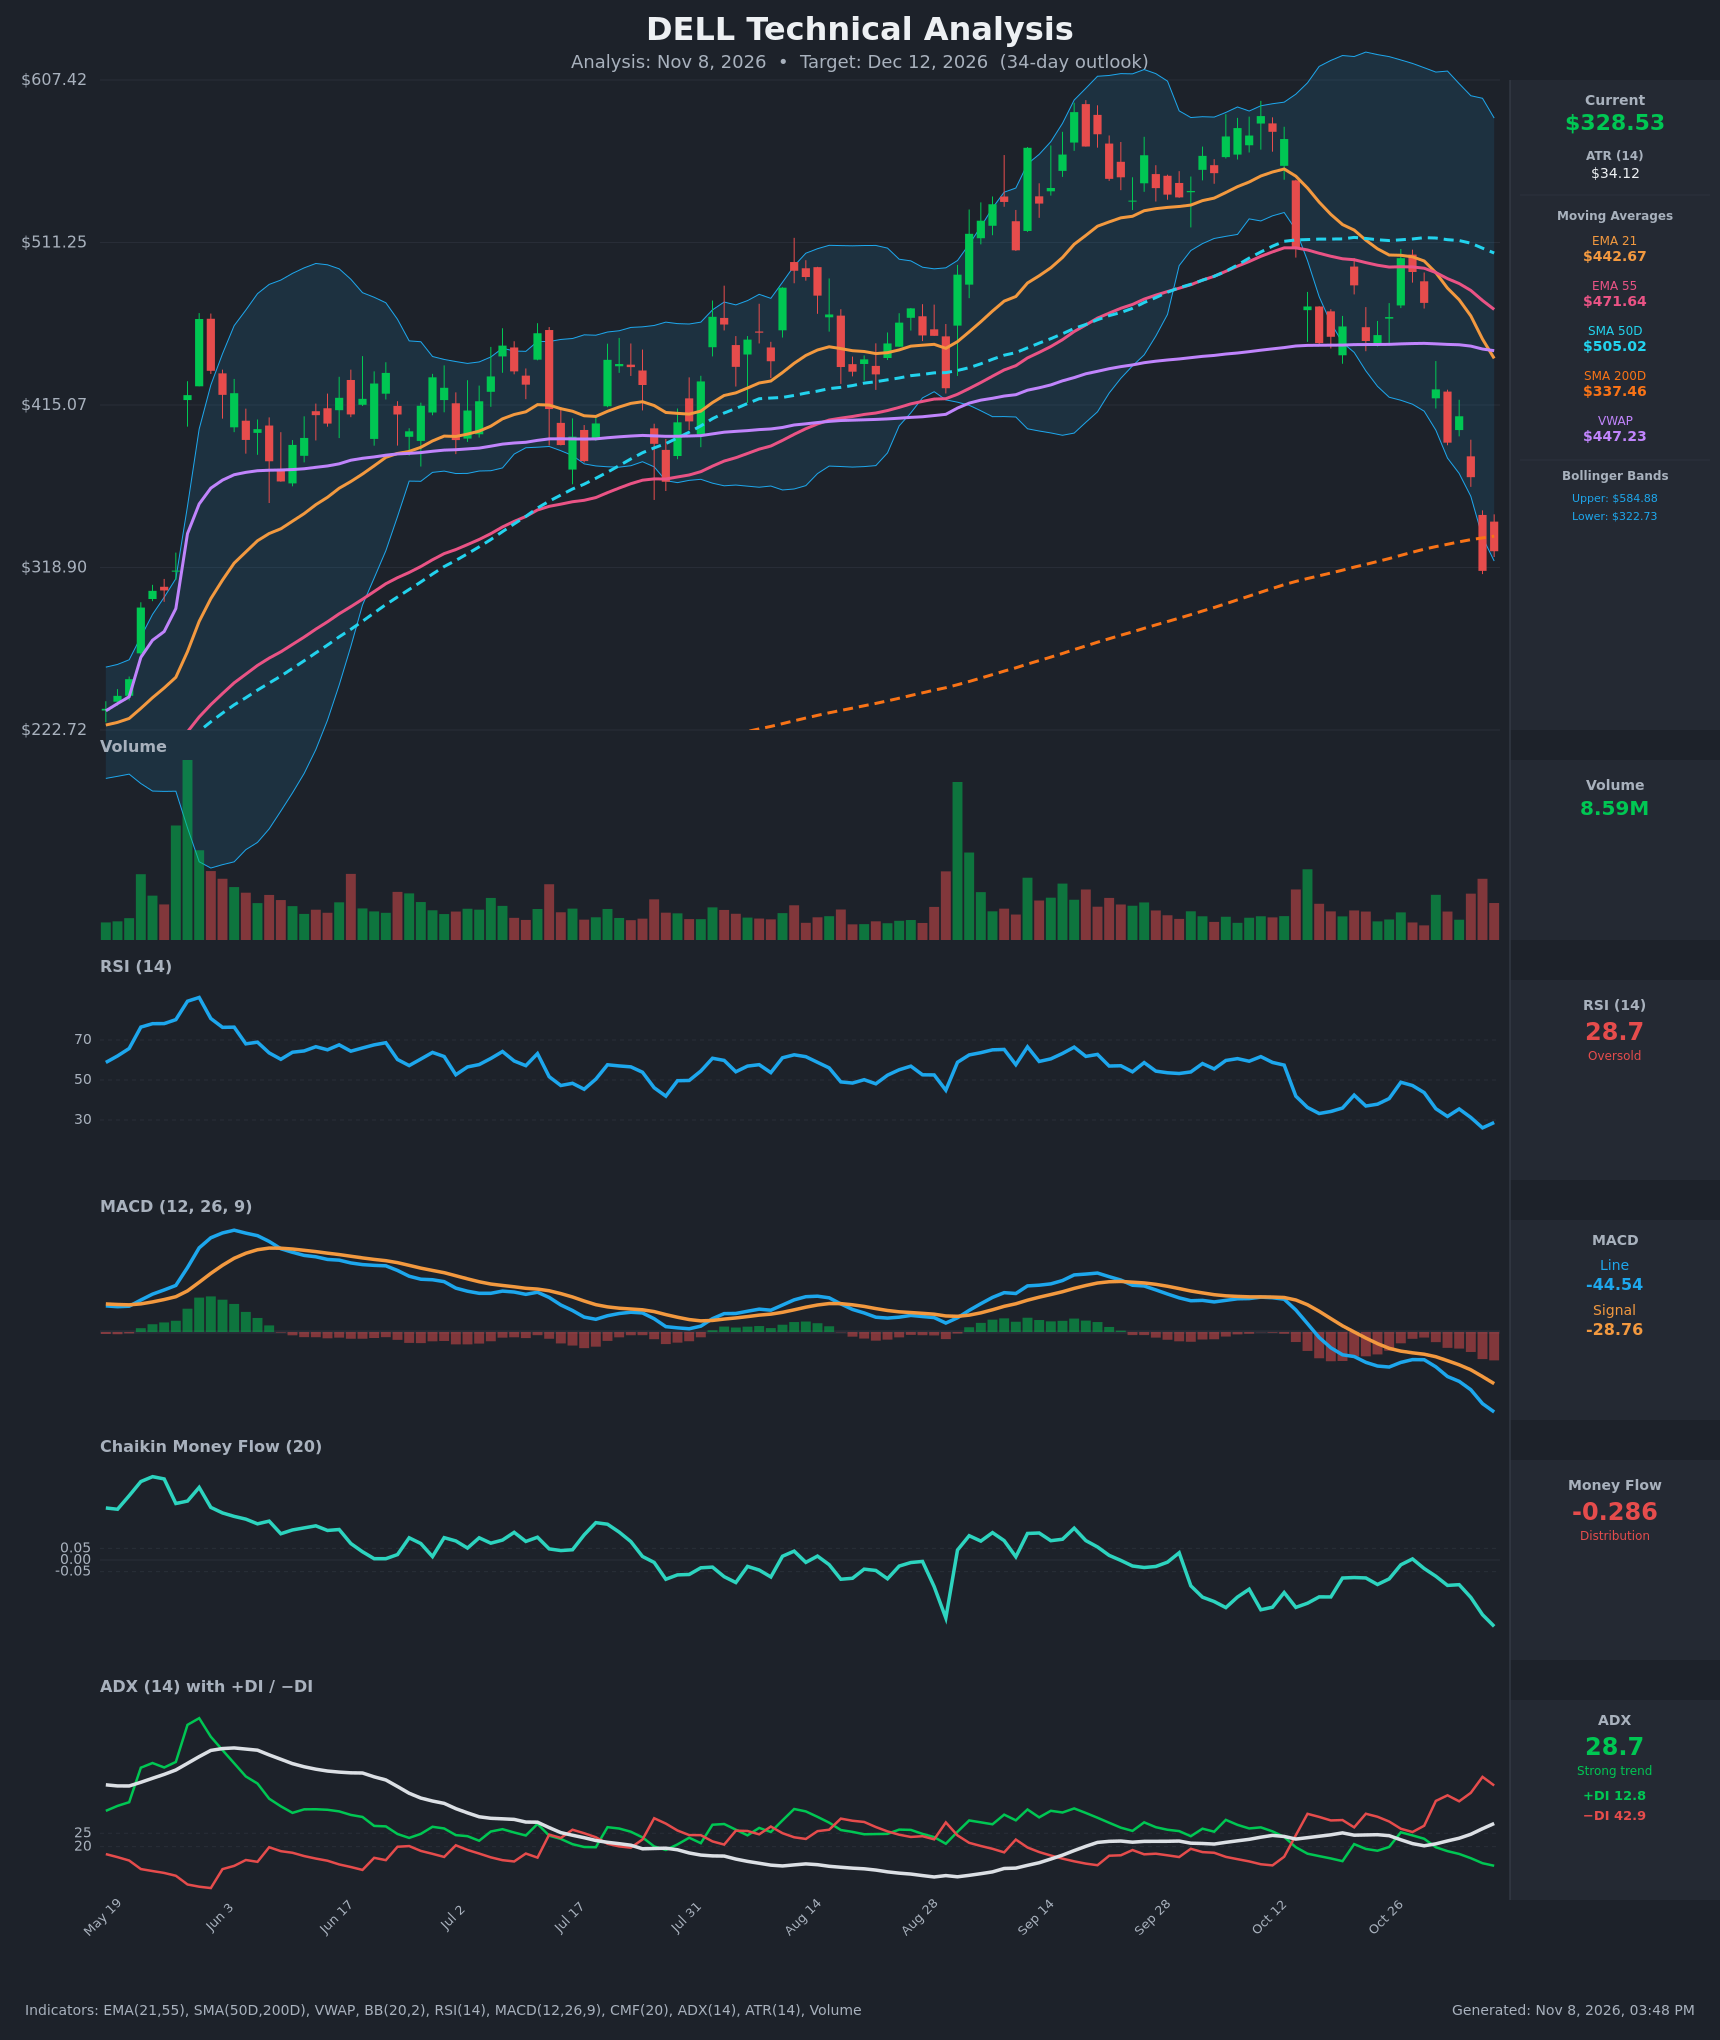
Analysis
TECHNICAL INDICATORS
- RSI (14): 28.74, in oversold territory. It fell from ~48 on Oct 27 to a low of 26.1 on Nov 5 and has only ticked up slightly. Momentum is still pointing down, with no bullish turn yet. [Bearish]
- 20 EMA (EMA 21): $442.67, about 35% above price and falling steeply. It crossed below the EMA 55 ($471.64) around Oct 30. Price is far below it, so it acts as overhead resistance. [Bearish]
- MACD: Line -44.54 is below signal -28.76 and the gap is widening. The bearish crossover happened around Oct 21-22, and the histogram is increasingly negative. There is no sign of momentum bottoming. [Bearish]
- Bollinger Bands (20): Price at $328.53 is hugging the lower band ($322.73) after a sharp expansion from the $584.88 upper band. Band-walking in a strong downtrend often continues, but a reversion toward the mid-band is also possible. Price is stretched. [Bearish]
- CMF (20): -0.286, well below -0.05 and making new lows. This is heavy, persistent distribution with sellers dominating. [Distribution]
- ADX (14): 28.7 and rising, with −DI at 42.9 far above +DI at 12.8. This is a strong, established downtrend with bears firmly in control. [Strong Trend – Bearish]
- Volume: 8.59M, around average to slightly elevated. The large down candles had moderate-to-heavy volume, but there is no obvious capitulation spike yet. Selling is orderly rather than exhausted. [Bearish – no capitulation confirmation]
Other moving averages:
- VWAP ($447.23): Price is about 27% below it, which signals sellers in control.
- SMA 200D ($337.46): Price has closed just below it for the first time in this move, a loss of long-term support. The SMA 50D ($505.02) is still above the SMA 200D, so there is no death cross yet.
DIVERGENCES & TRENDS
- There is no bullish RSI or MACD divergence. RSI made a new low (26.1) with price on Nov 5, and MACD and CMF are making new lows alongside price. The trend and momentum are confirming each other.
- The EMA 21 crossed below the EMA 55 around Oct 30, and price is below every moving average on the chart.
- The MACD bearish cross (Oct 22) preceded the leg down. −DI has been above +DI since mid-October, and ADX has turned up from 20 to 28.7, confirming trend strength.
- The Oct 26-29 bounce to ~$500 failed below the Sep-Oct highs near $590. That lower high set up the breakdown.
- The only counter-signals are the oversold RSI, price at the lower Bollinger Band, and a stretch ~35% below the EMA 21. Together they raise the odds of a relief bounce, but they are not a reversal signal on their own.
CHART PATTERNS
- There is no clean textbook pattern. The structure resembles a Bearish Head and Shoulders / lower-high topping structure. The peak was near $590 in late Sep-Oct, and the weaker rebound to ~$500 on Oct 27 was followed by a breakdown through the $415-$440 area. The breakdown has now carried price to the SMA 200D.
- The brief Oct 26-29 consolidation behaved like a failed Bearish Flag/Pennant. Its breakdown has been measured-move-like so far.
- The recent low at $316.91 and the $318 chart level are the nearest support. A close below them opens the prior consolidation zone in the high-$200s, near the $285-$300 region.
POTENTIAL SCENARIOS
- Scenario 1: Bearish Trend Continuation — Price fails to reclaim the SMA 200D, breaks the Nov 5 low, and continues lower under ADX >25 with −DI dominant, MACD falling and heavy distribution. Trigger: close below $316.91. Target: $285-$300, with possible overshoot toward $270. Invalidation: daily close above $372 (the Nov 4 close) with RSI back above 40. (55% probability)
- Scenario 2: Bullish Oversold Relief Bounce — RSI below 30 and price at the lower band trigger a mean-reversion rally that reclaims the SMA 200D. It is likely capped well below the falling EMAs. Trigger: close above $337.46 and then $372. Target: $375-$410. Invalidation: rejection at the SMA 200D and a new low below $316.91. (30% probability)
- Scenario 3: Neutral Base-Building — Price chops between roughly $300 and $345 as selling exhausts. Trigger: several closes between $316 and $345 with RSI stabilizing in the 30s. Target: ~$325-$335. Invalidation: a decisive close outside the $300-$345 range. (15% probability)
PRICE TARGETS
- Target Price: $308.00 (34-day outlook)
- Expected Range: $283.00 to $341.00 (width $58, about 17.7% of the current price, which fits the 30-60 day guidance)
- Key Levels: Support at $316.91, Resistance at $337.46
OVERALL BIAS
OVERALL BIAS: BEARISH - Price has lost the SMA 200D with a strong ADX (28.7), −DI far above +DI, a widening bearish MACD gap and deep CMF distribution. The oversold RSI raises bounce risk, but nothing yet signals a reversal, so continuation lower has the most evidence behind it.
This is educational analysis and not financial advice.