F 34-day bullish forecast — Nov 8, 2026
- Bias: Bullish
- Timeframe: 34 days (made Nov 8, 2026, target date Dec 11, 2026)
- Price at analysis: $12.44
- Price target: $12.85
- Expected range: $11.70 – $13.45
- Result: Pending — graded after the close on Dec 11, 2026
Get a free AI analysis of F today
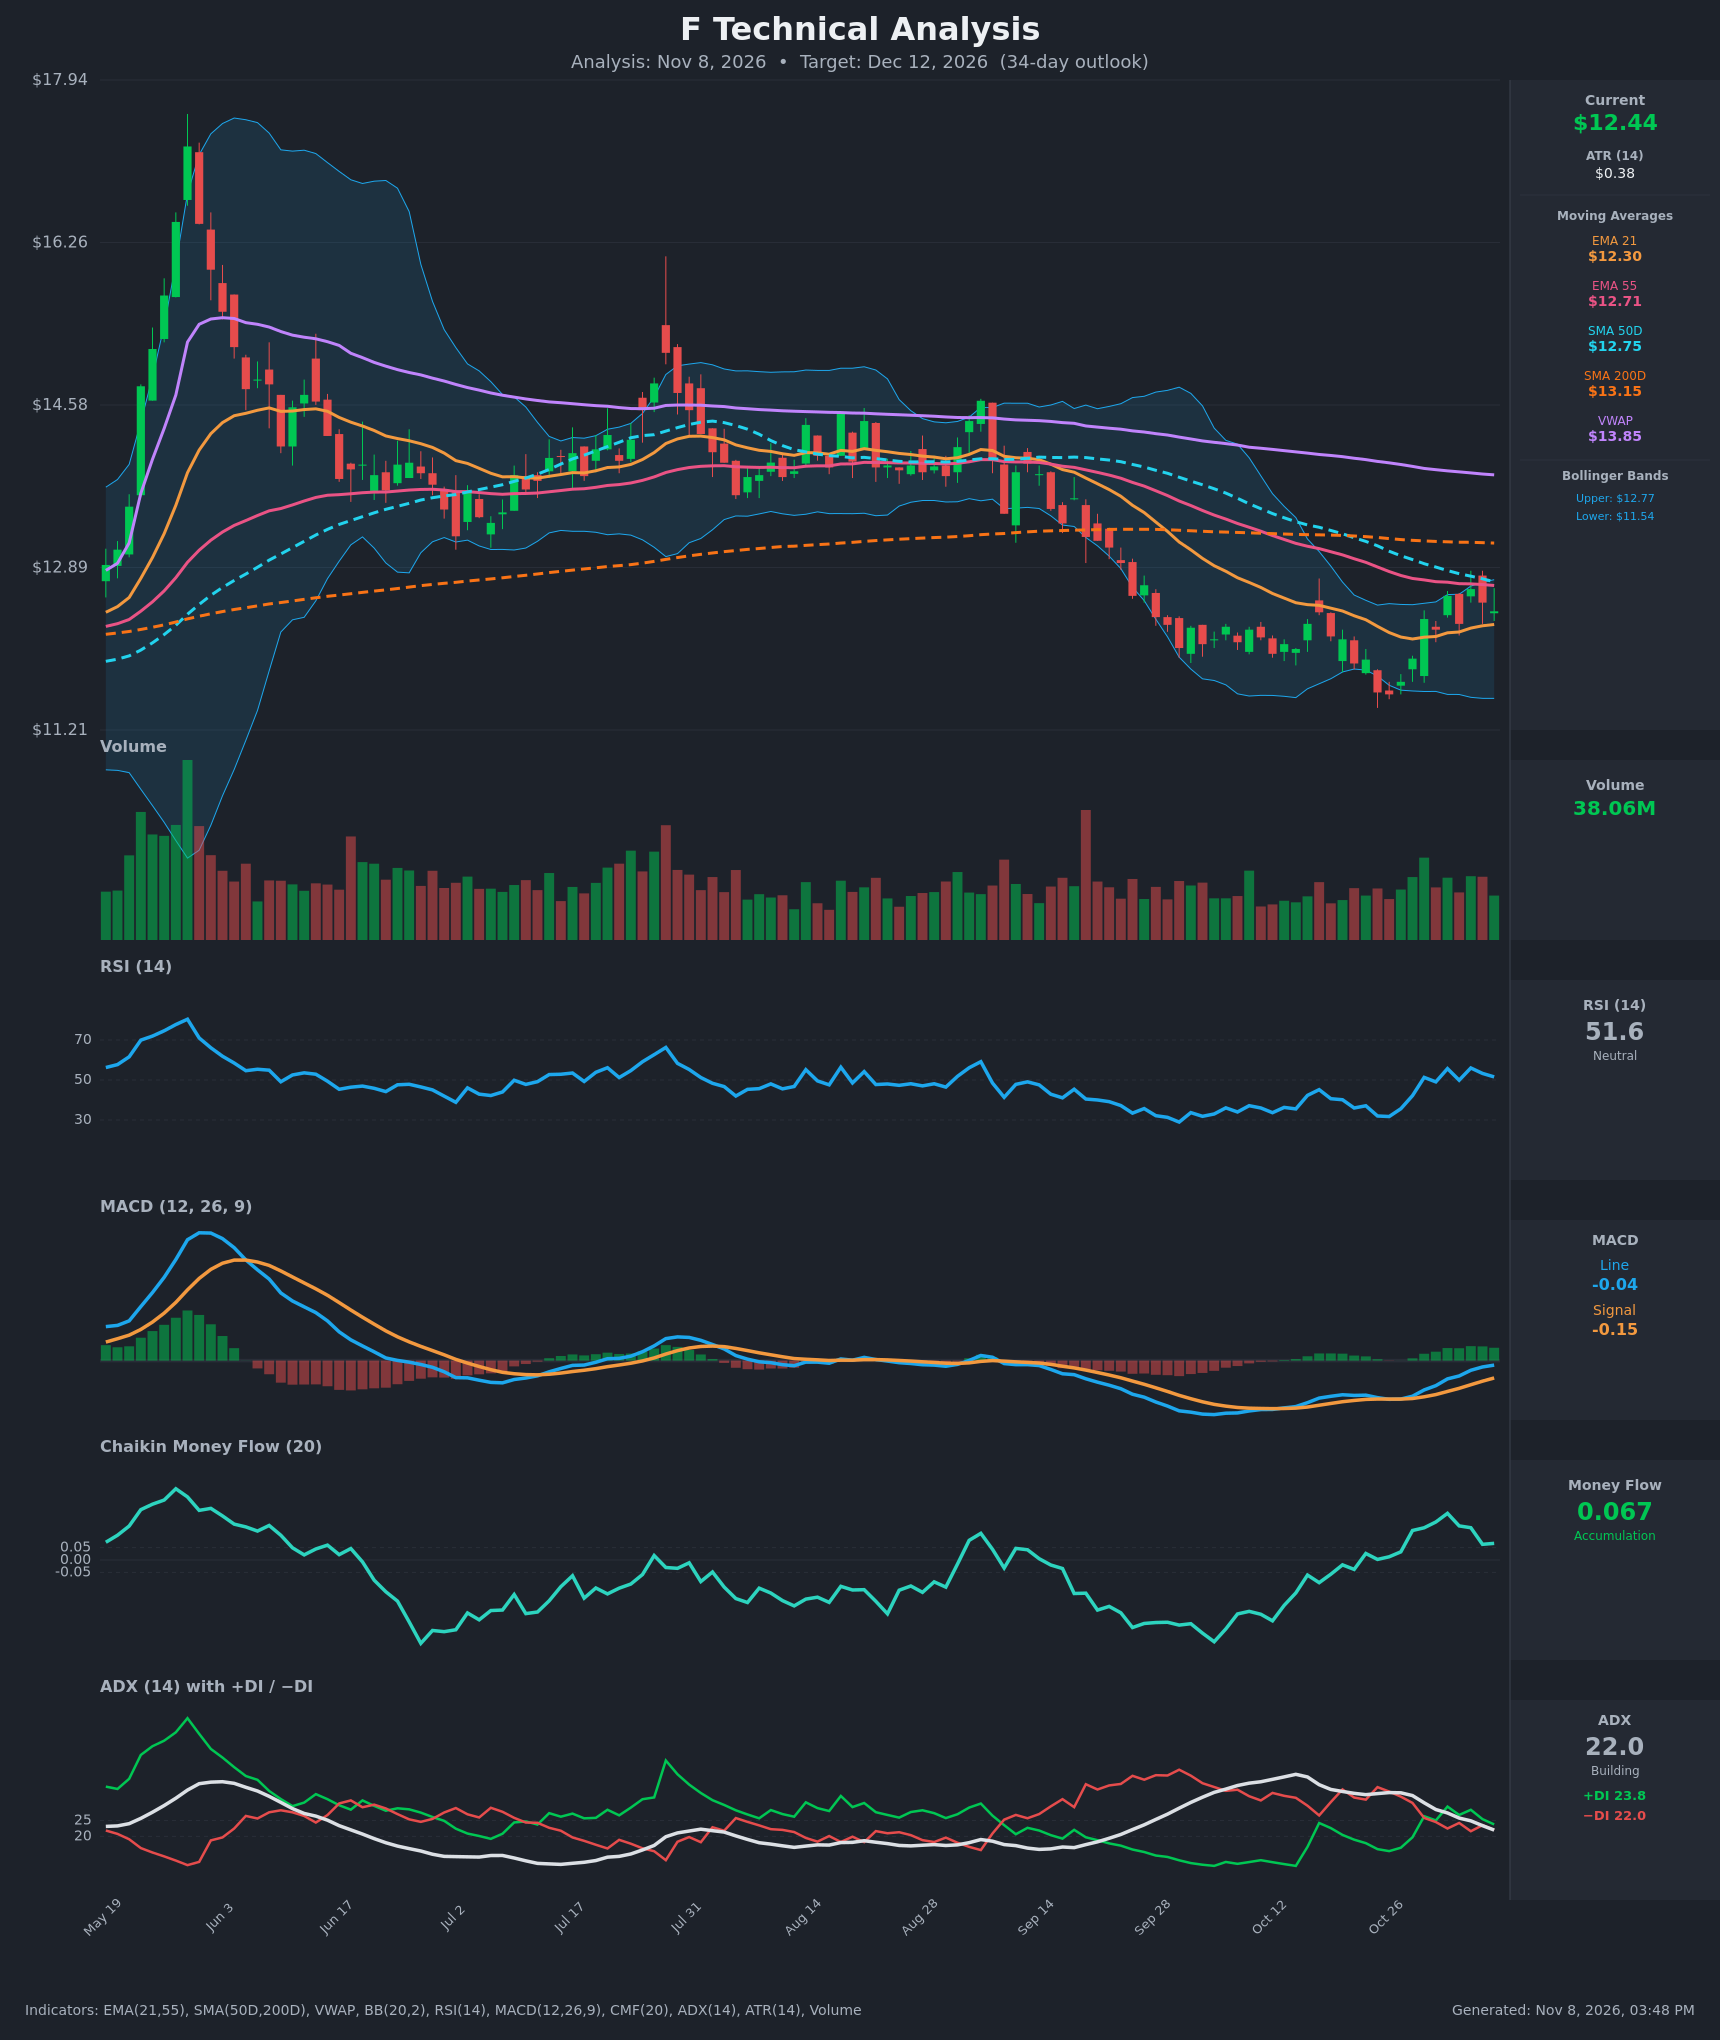
Analysis
TECHNICAL INDICATORS
- RSI (14): 51.55, neutral. It has climbed from a 31.7 oversold low on Oct 26 and is now basing around 50-56 after peaking at 56.0 on Nov 4. Momentum has recovered but is flattening. [Neutral]
- 20 EMA: The 21 EMA is $12.30 and price ($12.44) sits just above it, so it acts as near-term support. Price is still below the EMA55 ($12.71), which is overhead resistance. [Bullish]
- MACD: The line (-0.040) crossed above the signal (-0.154) around Oct 26-28 and has been rising steadily toward the zero line. The histogram is positive and has been expanding, though the latest bars are flattening. The MACD is still below zero, so this is a recovery rather than a confirmed trend change. [Bullish]
- Bollinger Bands (20): Upper $12.77, lower $11.54, midline about $12.15. Price is above the midline in the upper half of the band after bouncing off the lower band. The bands are narrowing, so a volatility expansion may be coming. The upper band lines up with the SMA50 and EMA55 as a resistance cluster. [Bullish]
- CMF (20): 0.067, above the +0.05 threshold. It has been positive since Oct 22 and peaked near 0.19 on Nov 2, but it is fading from the peak. This shows mild accumulation. [Accumulation]
- ADX (14): 22.0, falling from 34.8 as the prior downtrend loses strength. +DI (23.8) has crossed above −DI (22.0), but the margin is thin. This is a weak trend that favors a transition or range, with a slight bullish edge. [Weak Trend, slightly bullish]
- Volume: 38.06M, about average. Volume rose on the green candle that bounced off the lows and has been steady since, with no heavy distribution. Selling volume has faded from the Sep-Oct decline. [Neutral to mildly bullish]
DIVERGENCES & TRENDS
- Bullish divergence (resolved): Price made a lower low around Oct 26 while MACD and RSI held higher and CMF turned positive. The bounce has already played out.
- MA structure is still bearish: Price is below the SMA50 ($12.75), SMA200 ($13.15), and VWAP ($13.85). The SMA50 is below the SMA200 (a death cross that formed in September), and the EMA21 is below the EMA55. The EMA21 is narrowing the gap to the EMA55 ($12.30 vs $12.71), which hints at a possible bullish cross if the rally holds.
- Indicator trends: MACD is rising, the +DI/−DI crossover is bullish, and CMF is positive. ADX is falling, which means the old downtrend is exhausting.
- Key test: The $12.71-$12.77 cluster (EMA55, SMA50, upper Bollinger Band) is the immediate hurdle. Price has failed near it before (Nov 4 close of $12.67).
CHART PATTERNS
- Bullish Double Bottom (forming): Lows near $11.4-$11.6 in late October, with a neckline around $12.75 to $12.85. A close above the neckline would confirm it. The full measured move is about $14.1, but that is too far for 34 days. A realistic first target is the SMA200 near $13.15.
- Prior structure: The Aug-Oct decline looked like a bearish expanding/rising pattern that broke down. The current base is the first sign of that damage repairing.
- Alternative: A Bearish Pennant or flag is possible if price stalls under $12.75 and rolls over. That would target a retest of $11.6.
POTENTIAL SCENARIOS
- Scenario 1: Bullish Neckline Breakout — Price clears the $12.71-$12.77 resistance cluster, MACD moves above zero, and the EMA21 crosses above the EMA55. Trigger: daily close above $12.80 on rising volume. Target: $13.15 (SMA200), with an extension to about $13.45. Invalidation: close below $12.15 (Bollinger midline). (45% probability)
- Scenario 2: Neutral Range Chop — Price is capped by the $12.75 cluster and supported by the EMA21 and Bollinger midline, with weak ADX. Trigger: repeated failures at $12.75 and holds above $12.20. Target: $12.15-$12.75. Invalidation: a close outside that range. (28% probability)
- Scenario 3: Bearish Rejection — The rally fades at the falling averages, +DI loses its edge, and the broader downtrend resumes. Trigger: close below $12.15, then below $11.95. Target: $11.55-$11.70, a retest of the October lows. Invalidation: close above $12.80. (27% probability)
PRICE TARGETS
- Target Price: $12.85 (34-day, about +3.3%)
- Expected Range: $11.70 to $13.45 (width $1.75, about 14.1% of current price, consistent with the 30-60 day guidance)
- Key Levels: Support at $12.30 (EMA21; deeper support at $11.58), Resistance at $12.75 (SMA50/EMA55 cluster; next resistance at $13.15)
OVERALL BIAS
OVERALL BIAS: BULLISH - Momentum has turned up (MACD bullish cross, +DI above −DI, CMF in accumulation) after a bounce off the $11.5 area, and price holds above the EMA21. Conviction is modest because price is still below the SMA50, SMA200, and VWAP, so a breakout above $12.77 is needed to confirm the move toward $13.15.
This is educational analysis and not financial advice.