IBM 34-day bearish forecast — Nov 8, 2026
- Bias: Bearish
- Timeframe: 34 days (made Nov 8, 2026, target date Dec 11, 2026)
- Price at analysis: $245.00
- Price target: $237.50
- Expected range: $220.00 – $257.00
- Result: Pending — graded after the close on Dec 11, 2026
Get a free AI analysis of IBM today
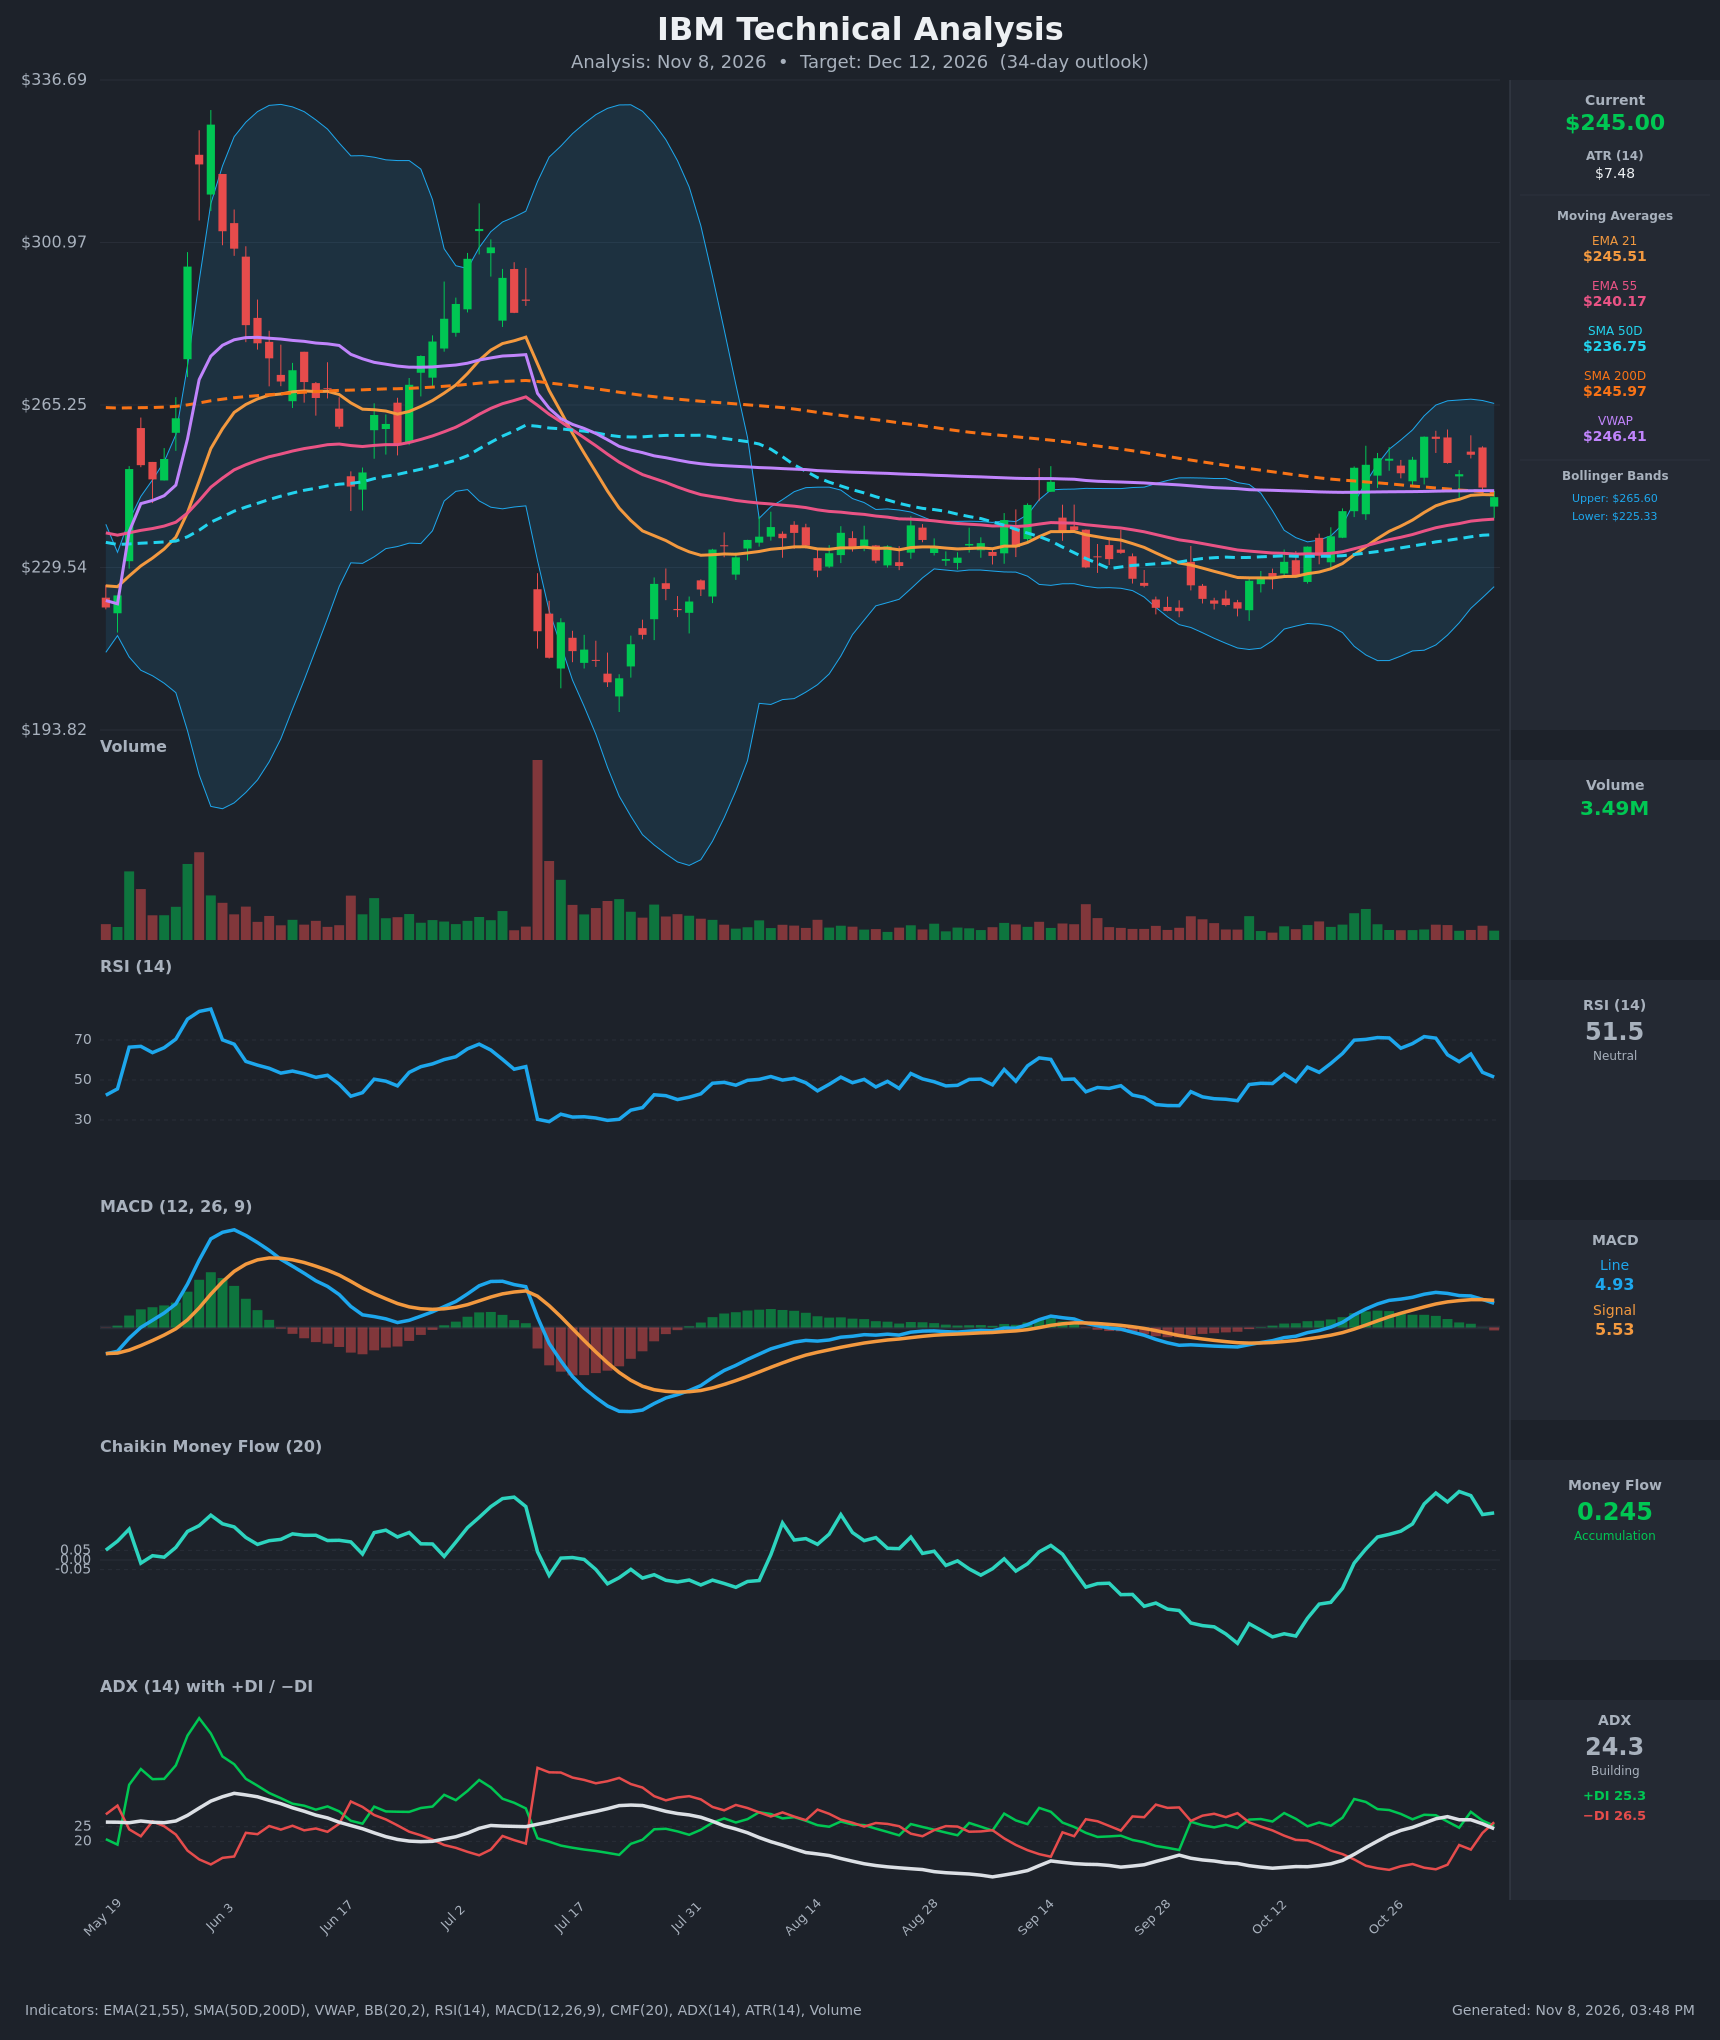
Analysis
TECHNICAL INDICATORS
- RSI (14): 51.5, down sharply from 71.7 on Oct 29 and now at the neutral midline. Momentum has rolled over, with no oversold or overbought signal. [Bearish]
- 20 EMA (EMA 21): $245.51. Price at $245.00 has slipped just below it after holding above since Nov 4. EMA 21 is still above EMA 55 ($240.17), so the medium-term structure is intact, but the EMA 21 is now flattening and acting as resistance. [Neutral]
- MACD: Line 4.93 vs signal 5.53, a bearish crossover on Nov 6. The line has fallen from a 7.16 peak, so the histogram is negative and widening. Momentum is fading from the October rally. [Bearish]
- Bollinger Bands (20): Upper $265.60, lower $225.33, midline about $245.5. Price sits right on the midline after failing to reach the upper band, so there is no edge from the bands. The recent band expansion is stalling. [Neutral]
- CMF (20): +0.245, well above +0.05, but down from a 0.357 peak on Nov 3. Buying pressure is still positive, though it is clearly fading as price slips. [Accumulation]
- ADX (14): 24.3, falling from 28.4, just below the 25 threshold. −DI (26.5) has crossed above +DI (25.3), a bearish DI crossover. The October uptrend is losing strength and bears are taking marginal control. [Weak Trend, bearish tilt]
- Volume: 3.49M, light and below the recent rally-day volume. The pullback is on quiet volume, which is not aggressive distribution, but there is also no volume support for a bounce. [Neutral]
DIVERGENCES & TRENDS
- Price made higher highs on Oct 29 ($258.28), but RSI and MACD have since rolled over. The +DI peak (34.5) was on Oct 21 and the ADX trend peak is now rolling over too, which is momentum deterioration rather than a clean divergence.
- CMF (+0.245) is bullish and is the main counter-signal. A CMF this high with a weakening price often signals a consolidation rather than a collapse.
- Crossovers: MACD bearish cross (Nov 6) and −DI over +DI (Nov 6). Price has also lost EMA 21, VWAP ($246.41) and SMA 200 ($245.97) at once.
- SMA 50 ($236.75) is below SMA 200 ($245.97), so there is no golden cross. They are converging, but the long-term trend is still unresolved.
- Price tested the SMA 200 and VWAP cluster at $246 to $248 and was rejected. It is now back below that cluster.
- Price is still above EMA 55 ($240.17) and SMA 50 ($236.75), the dynamic supports that must hold to keep the October advance alive.
CHART PATTERNS
- Bearish Double/Triple Top: Highs near $253.5 (Oct 23), $258.3 (Oct 29/30) and $254.3 (Nov 4) formed a rounded top zone. A break below the ~$250 neckline (Nov 3 low of $250.04) was confirmed by the close at $247 on Nov 5. The measured move is about $258 − $250 = $8 to $11 below the neckline, or roughly $237 to $240. That lines up with EMA 55 and SMA 50.
- Broader context: The chart shows a large range ($225 to $265) over three months, with the SMA 200 acting as a ceiling. A break above $258 would invalidate the topping pattern.
POTENTIAL SCENARIOS
- Scenario 1: Bearish Pullback to Moving-Average Support — The double/triple-top breakdown plays out, with the MACD and DI crossovers adding pressure. Price drifts toward EMA 55 and SMA 50 and could briefly test the Bollinger midline-to-lower area. Trigger: daily close below $243 and then below EMA 55 at $240. Target: $237 to $240, with an extension to $230. Invalidation: daily close above $252. (50% probability)
- Scenario 2: Bullish Reclaim and Breakout — Strong CMF accumulation carries price back above the $246 cluster (EMA 21, SMA 200, VWAP), with a retest of the October highs. Trigger: close above $247 on rising volume. Target: $258 to $265 (upper Bollinger Band). Invalidation: close below $240. (35% probability)
- Scenario 3: Neutral Range Consolidation — Price chops between $237 and $253 as ADX stays below 25. Trigger: ADX falling below 20 and repeated tests of both boundaries. Target: $243 to $248. Invalidation: a close outside $236 to $254. (15% probability)
PRICE TARGETS
- Target Price: $237.50 (34 days, about -3.1%)
- Expected Range: $220.00 to $257.00 (width $37.00, about 15.1% of the current price, in line with the 12-18% guidance for 30-60 days)
- Key Levels: Support at $236.75 (SMA 50, with EMA 55 at $240.17 above it), Resistance at $254.30
OVERALL BIAS
OVERALL BIAS: BEARISH - A top-pattern breakdown, a bearish MACD crossover, a −DI/+DI crossover, and price losing EMA 21, VWAP and SMA 200 simultaneously point to a pullback toward $237 to $240. Conviction is modest because CMF is still firmly positive and the larger uptrend support (EMA 55, SMA 50) has not yet broken.
This is educational analysis and not financial advice.