GOOGL 34-day bullish forecast — Nov 8, 2026
- Bias: Bullish
- Timeframe: 34 days (made Nov 8, 2026, target date Dec 11, 2026)
- Price at analysis: $284.78
- Price target: $298.00
- Expected range: $268.00 – $314.00
- Result: Pending — graded after the close on Dec 11, 2026
Get a free AI analysis of GOOGL today
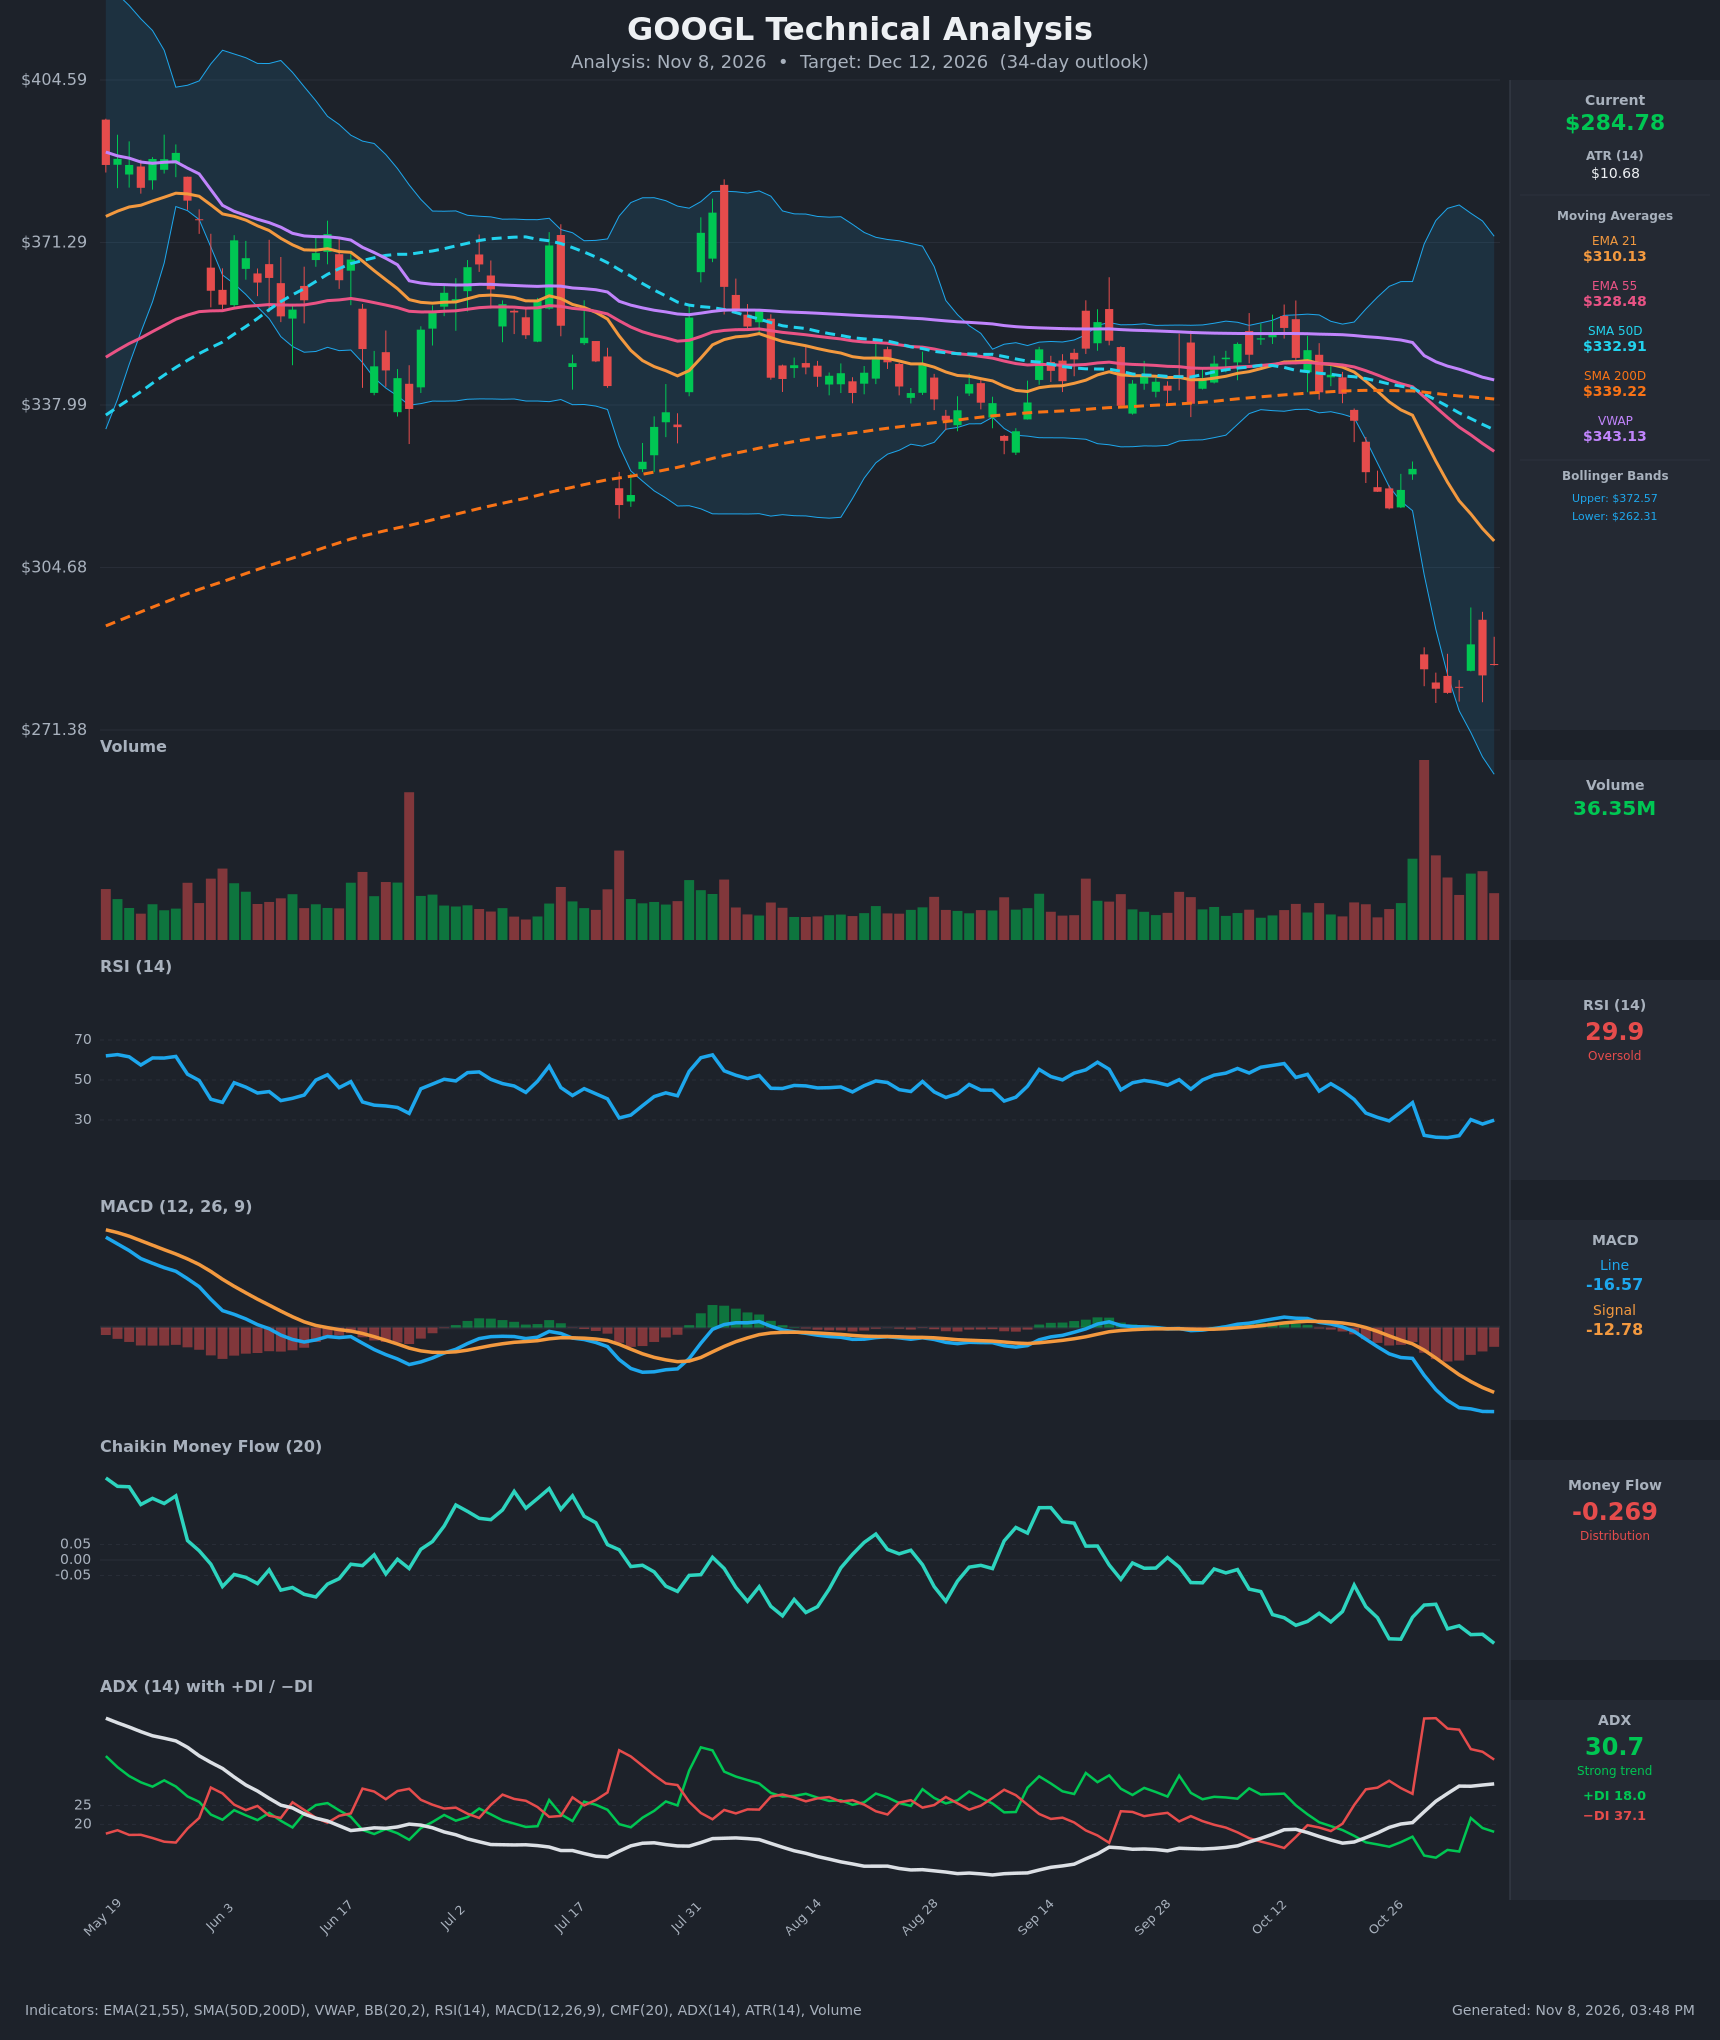
Analysis
TECHNICAL INDICATORS
- RSI (14): 29.92, just under the oversold line. It hit a low of 21.2 on Nov 2 and has since turned up to the high 20s/30. The higher low versus the Oct 29-Nov 2 trough shows selling momentum fading, but the reading is still weak. [Neutral]
- 20 EMA: The 21 EMA is $310.13 and sloping down steeply. Price at $284.78 is about 8% below it, so it acts as overhead resistance. EMA21 is also well below EMA55 ($328.48), a bearish alignment. [Bearish]
- MACD: Line -16.57 is below signal -12.78 and the gap is widening, with a negative and expanding histogram. The bearish crossover happened around Oct 21-22. The line is still making new lows, so there is no sign of a momentum turn yet. [Bearish]
- Bollinger Bands (20): Upper $372.57, lower $262.31. The bands have expanded sharply after the Oct 29 gap. Price sits in the lower third, about $22 above the lower band, after hugging or piercing it during the selloff. The wide bands imply high volatility, and a stabilization here could trigger a mean-reversion move toward the midline (~$317). [Neutral]
- CMF (20): -0.269, deep in distribution and near the cycle low. It has been negative for months and keeps falling, so sellers are still in control. [Distribution]
- ADX (14): 30.7 and rising, with −DI (37.1) well above +DI (18.0). This is a strong downtrend. −DI has eased from 48 and +DI has ticked up from 11, so the downside thrust is cooling, but the bears remain in control. [Strong Trend – Bearish]
- Volume: 36.35M, elevated versus the prior baseline. The Oct 29 gap-down came on a huge volume spike (capitulation-type). Volume has stayed above average since, with no volume dry-up yet. The latest bar is a red candle with a long upper wick, which suggests supply on rallies. [Bearish with possible exhaustion]
DIVERGENCES & TRENDS
- Moving average structure: Price is below EMA21, EMA55, SMA50D ($332.91), SMA200D ($339.22) and VWAP ($343.13), a full bearish stack. EMA21 crossed below EMA55 around Oct 22-23. SMA50D is still just under SMA200D, so a death cross is imminent or just formed and would add to the long-term bearish read.
- Mild bullish RSI divergence (short-term): Price made roughly equal lows at $279-$280 (Oct 30-Nov 3), and RSI has held 21-22 and is now ~30. That is stabilization rather than a clean divergence.
- MACD is still extending lower with no divergence, and CMF is making new lows, which confirms the selling.
- ADX/DI: −DI crossed above +DI on Oct 21 and has stayed dominant. ADX above 30 and rising confirms trend strength. A fall in −DI toward +DI would be the first sign of a trend change.
- Price action: The Oct 29 gap-down of about 12.6% was the main event. Since then price has based sideways in a tight $279-$289 zone for six sessions. The gap left unfilled supply at $316-$325.
CHART PATTERNS
- Triple-bottom base (diagram: "Bullish Triple Top", the mirrored triple-bottom structure): Lows at ~$279.84, ~$278.99 and ~$280.03 form a flat support shelf, with a neckline near the $288.93 rebound high. A close above $289 would confirm it, with a measured target of about $298-$300 (~$10 pattern height added to the neckline).
- Competing bearish continuation (Bearish Pennant/Flag): After a sharp impulse drop, the tight sideways consolidation is also consistent with a pause before another leg lower. The measured move from the breakdown would target the $255-$262 area (the lower Bollinger Band and below).
- Gap-fill dynamics: The $316-$325 gap zone and EMA21 at $310 are the logical upper limit for any relief rally.
POTENTIAL SCENARIOS
- Scenario 1: Bullish Oversold Relief Bounce / Base Hold — The $279-$280 triple-bottom shelf holds and price recovers on short covering, with RSI lifting above 40 and −DI continuing to fade. The rally stalls beneath the declining EMA21. Trigger: daily close above $288.93, then above $296. Target: $298-$310 (EMA21). Invalidation: daily close below $278. (45% probability)
- Scenario 2: Bearish Breakdown / Trend Continuation — Distribution continues (CMF -0.27, ADX over 30, MACD widening) and the consolidation resolves as a bearish pennant. Trigger: close below $278.50 on rising volume. Target: $262 (lower BB), then $255 (about 1x ATR extension of the base and measured move). Invalidation: close above $296. (40% probability)
- Scenario 3: Neutral Range Chop — Price oscillates between $279 and $300 as the market digests the gap, with the MAs continuing to fall toward price. Trigger: failure to break either $278 or $296 for several weeks. Target: $282-$295. Invalidation: close outside $275-$300. (15% probability)
PRICE TARGETS
- Target Price: $298.00 (34-day horizon, a modest relief bounce toward the underside of the gap and EMA21)
- Expected Range: $268.00 to $314.00 (width $46 ≈ 16.2% of the current price, consistent with the 30-60 day guidance of 12-18%)
- Key Levels: Support at $278.50 (triple-bottom shelf, with $262.31 lower Bollinger Band below), Resistance at $310.13 (EMA21, with minor resistance at $288.93)
OVERALL BIAS
OVERALL BIAS: BULLISH - Conviction is modest. Price is deeply oversold (RSI ~30, after 21), has held a triple-bottom shelf at ~$279 after a capitulation gap on heavy volume, and sits well below its mean, so a partial retracement toward $298-$310 is slightly more likely than a continued slide. Trend indicators (ADX 30.7 with −DI dominant, MACD, CMF at -0.27, full bearish MA stack) remain bearish, so a close below $278 would flip the view toward $262.
This is educational analysis and not financial advice.