MSFT 34-day bullish forecast — Nov 8, 2026
- Bias: Bullish
- Timeframe: 34 days (made Nov 8, 2026, target date Dec 11, 2026)
- Price at analysis: $530.61
- Price target: $543.00
- Expected range: $493.00 – $571.00
- Result: Pending — graded after the close on Dec 11, 2026
Get a free AI analysis of MSFT today
Analysis
TECHNICAL INDICATORS
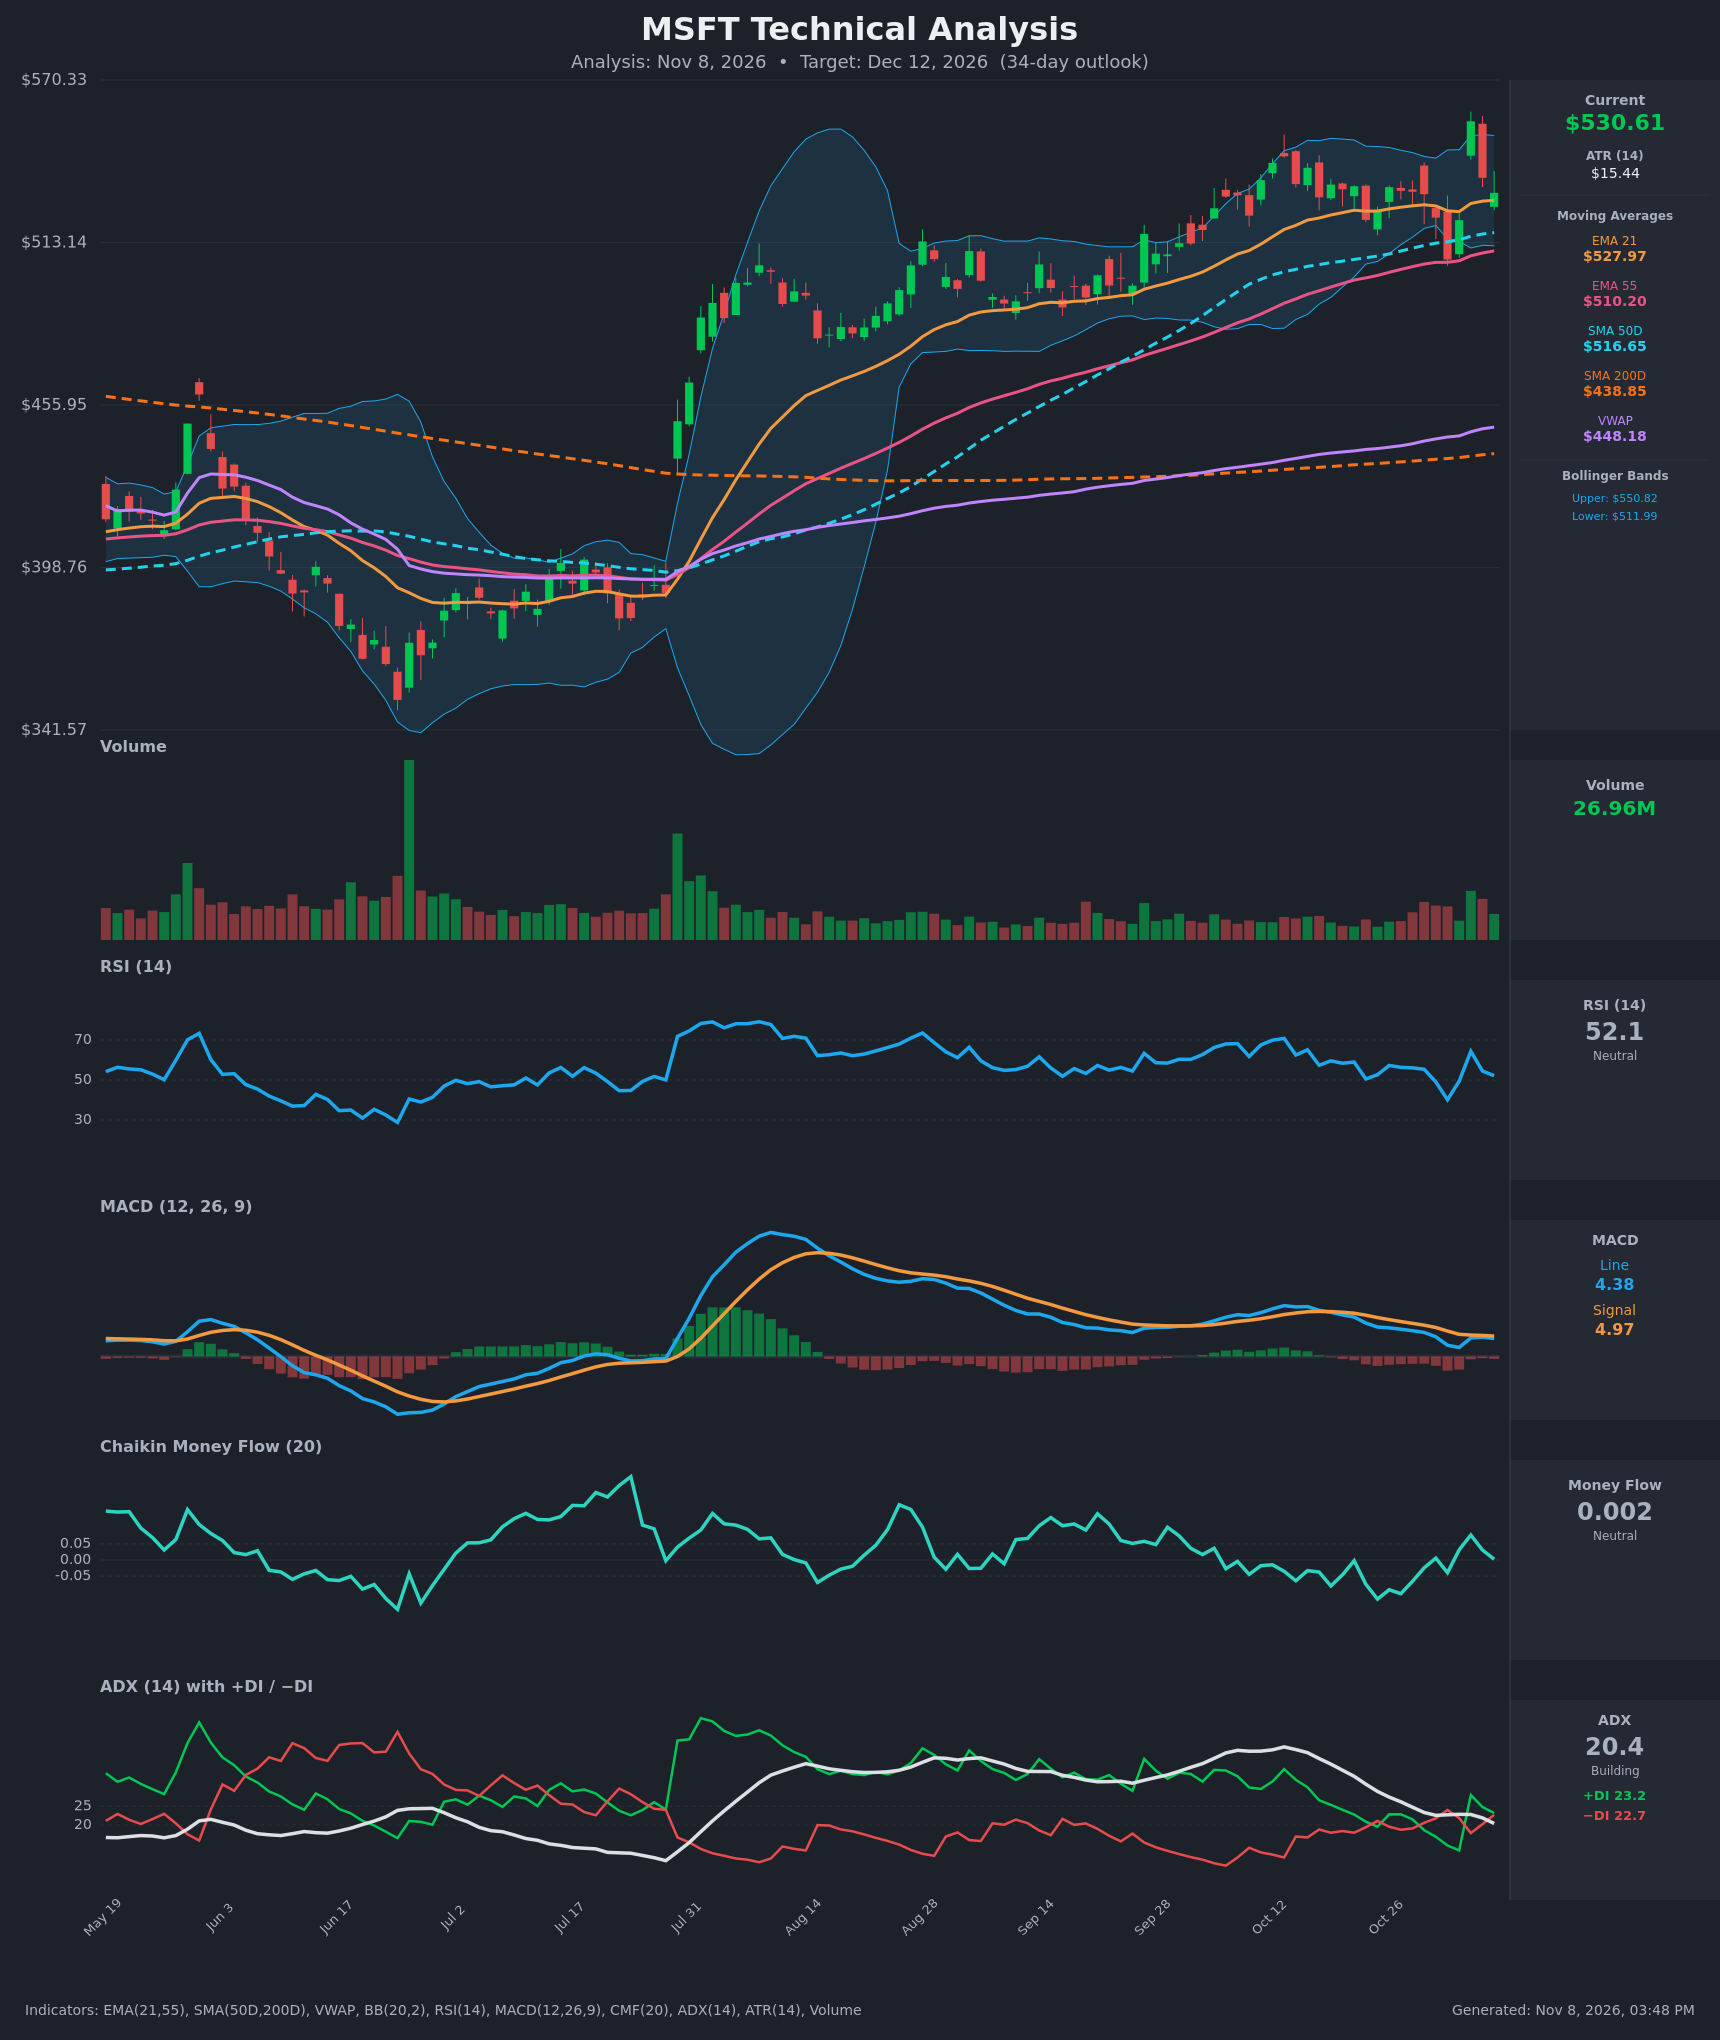
- RSI (14): 52.15, neutral. It fell to 40.1 on Nov 2, spiked to 64.3 on Nov 4, and has faded back to the midline. No overbought or oversold condition, and momentum is flat to slightly softening. [Neutral]
- 20 EMA: The 21 EMA is $527.97 and price ($530.61) is just above it. EMA21 is well above EMA55 ($510.20), so the medium-term trend is up. Price is only about $2.60 above the average, so support is thin. [Bullish]
- MACD: Line 4.38 is below Signal 4.97, a bearish crossover that happened in mid-October. Both lines are positive but declining toward zero, and the histogram is slightly negative at about -0.59. The Nov 4 spike briefly narrowed the gap, but momentum has not turned back up. [Bearish]
- Bollinger Bands (20): Upper $550.82, lower $511.99, midline about $531.4. Price sits almost exactly on the midline. The bands are moderately wide, and the Nov 4 spike to $555.80 poked above the upper band and was rejected. [Neutral]
- CMF (20): 0.002, inside the ±0.05 neutral zone. It has oscillated around zero for weeks, with no sustained accumulation or distribution. [Neutral]
- ADX (14): 20.4 and falling from 36 in mid-October, so the trend is weak. +DI 23.2 is barely above -DI 22.7, and the DI lines have crossed repeatedly. This reads as consolidation or a trend pause, not a directional move. [Weak Trend – slight bullish tilt]
- Volume: 26.96M, near the recent average with no expansion. The Nov 4 spike (+6.7%) was followed by a full retracement of about half the move on unremarkable volume. There is no sign of heavy distribution or conviction buying. [Neutral]
DIVERGENCES & TRENDS
- Trend structure: Price is above SMA50 ($516.65), SMA200 ($438.85) and VWAP ($448.18). The golden cross is well established and the MAs are stacked bullishly (EMA21 > SMA50 > EMA55 > SMA200). The higher-low structure since August is intact.
- Momentum fading: MACD has been trending down since September while price made marginal new highs, a mild bearish divergence. ADX has dropped from 36 to 20, so the rally has lost thrust.
- Crossovers: MACD is bearish (line below signal). The +DI/-DI lines are intertwined with no decisive crossover. EMA21 is still above EMA55 with no death-cross risk, although the gap has narrowed from about 25 to about 18 points.
- CMF and RSI: Both are flat at neutral, so neither confirms nor contradicts the trend.
- Overall: The long-term trend is bullish and short-term momentum is neutral to slightly weak, which suggests a consolidation inside an uptrend.
CHART PATTERNS
- Rectangle/consolidation inside an uptrend (closest to a Bullish Flag or Ascending structure): Since mid-October price has held between about $507 and $556 above rising SMA50/EMA55 support. The prior advance and the shallow pullback fit a continuation setup. A close above $556 would target roughly $575–$590, the range height projected upward.
- Bearish Expanding Triangle (risk case): The last 3 weeks show a widening range, with highs rising from $533 to $556 and lows falling from $521 to $507. If price breaks below the $507–$511 area (SMA50/EMA55/lower band), the pattern would target roughly $485–$495.
- Bearish double top: Not confirmed. The $555.80 spike is a single failed upside probe, and nothing near that level has repeated.
- Net read: The trend favors continuation, but the pattern is unresolved until $556 or $507 breaks.
POTENTIAL SCENARIOS
- Scenario 1: Bullish Trend Continuation — Price holds the EMA21/SMA50 zone, MACD re-crosses above its signal, and the market retests and breaks the Nov 4 high. Trigger: daily close above $556 on rising volume, or a bounce from $516–$528 with MACD turning up. Target: $555–$575. Invalidation: daily close below $507. (45% probability)
- Scenario 2: Neutral Range-Bound Chop — Weak ADX persists and price oscillates between about $508 and $556 around the Bollinger midline. Trigger: ADX stays below 20–22 with repeated failures at both extremes. Target: $520–$545. Invalidation: a decisive close outside $507–$556. (30% probability)
- Scenario 3: Bearish Breakdown — The widening range and bearish MACD resolve lower as price loses the moving-average cluster. Trigger: daily close below $511 (lower band/EMA55), with -DI taking control and ADX rising. Target: $485–$495, then the $470s. Invalidation: reclaim of $535 on a closing basis. (25% probability)
PRICE TARGETS
- Target Price: $543.00 (34-day horizon, Dec 12, 2026)
- Expected Range: $493.00 to $571.00 (width $78, about 14.7% of the current price, consistent with the 30–60 day guidance of 12–18%)
- Key Levels: Support at $516.65 (SMA50, with EMA55 at $510.20 below it), Resistance at $555.80 (Nov 4 high)
OVERALL BIAS
OVERALL BIAS: BULLISH - The long-term uptrend is intact, with price above all major moving averages, a golden cross in place, and higher lows since August. Momentum is stalling (MACD below signal, ADX only 20), so conviction is modest and the move is more likely a grind toward the $556 resistance than a sharp rally.
This is educational analysis and not financial advice.