NBIS 34-day bearish forecast — Nov 8, 2026
- Bias: Bearish
- Timeframe: 34 days (made Nov 8, 2026, target date Dec 11, 2026)
- Price at analysis: $129.49
- Price target: $118.00
- Expected range: $98.00 – $142.00
- Result: Pending — graded after the close on Dec 11, 2026
Get a free AI analysis of NBIS today
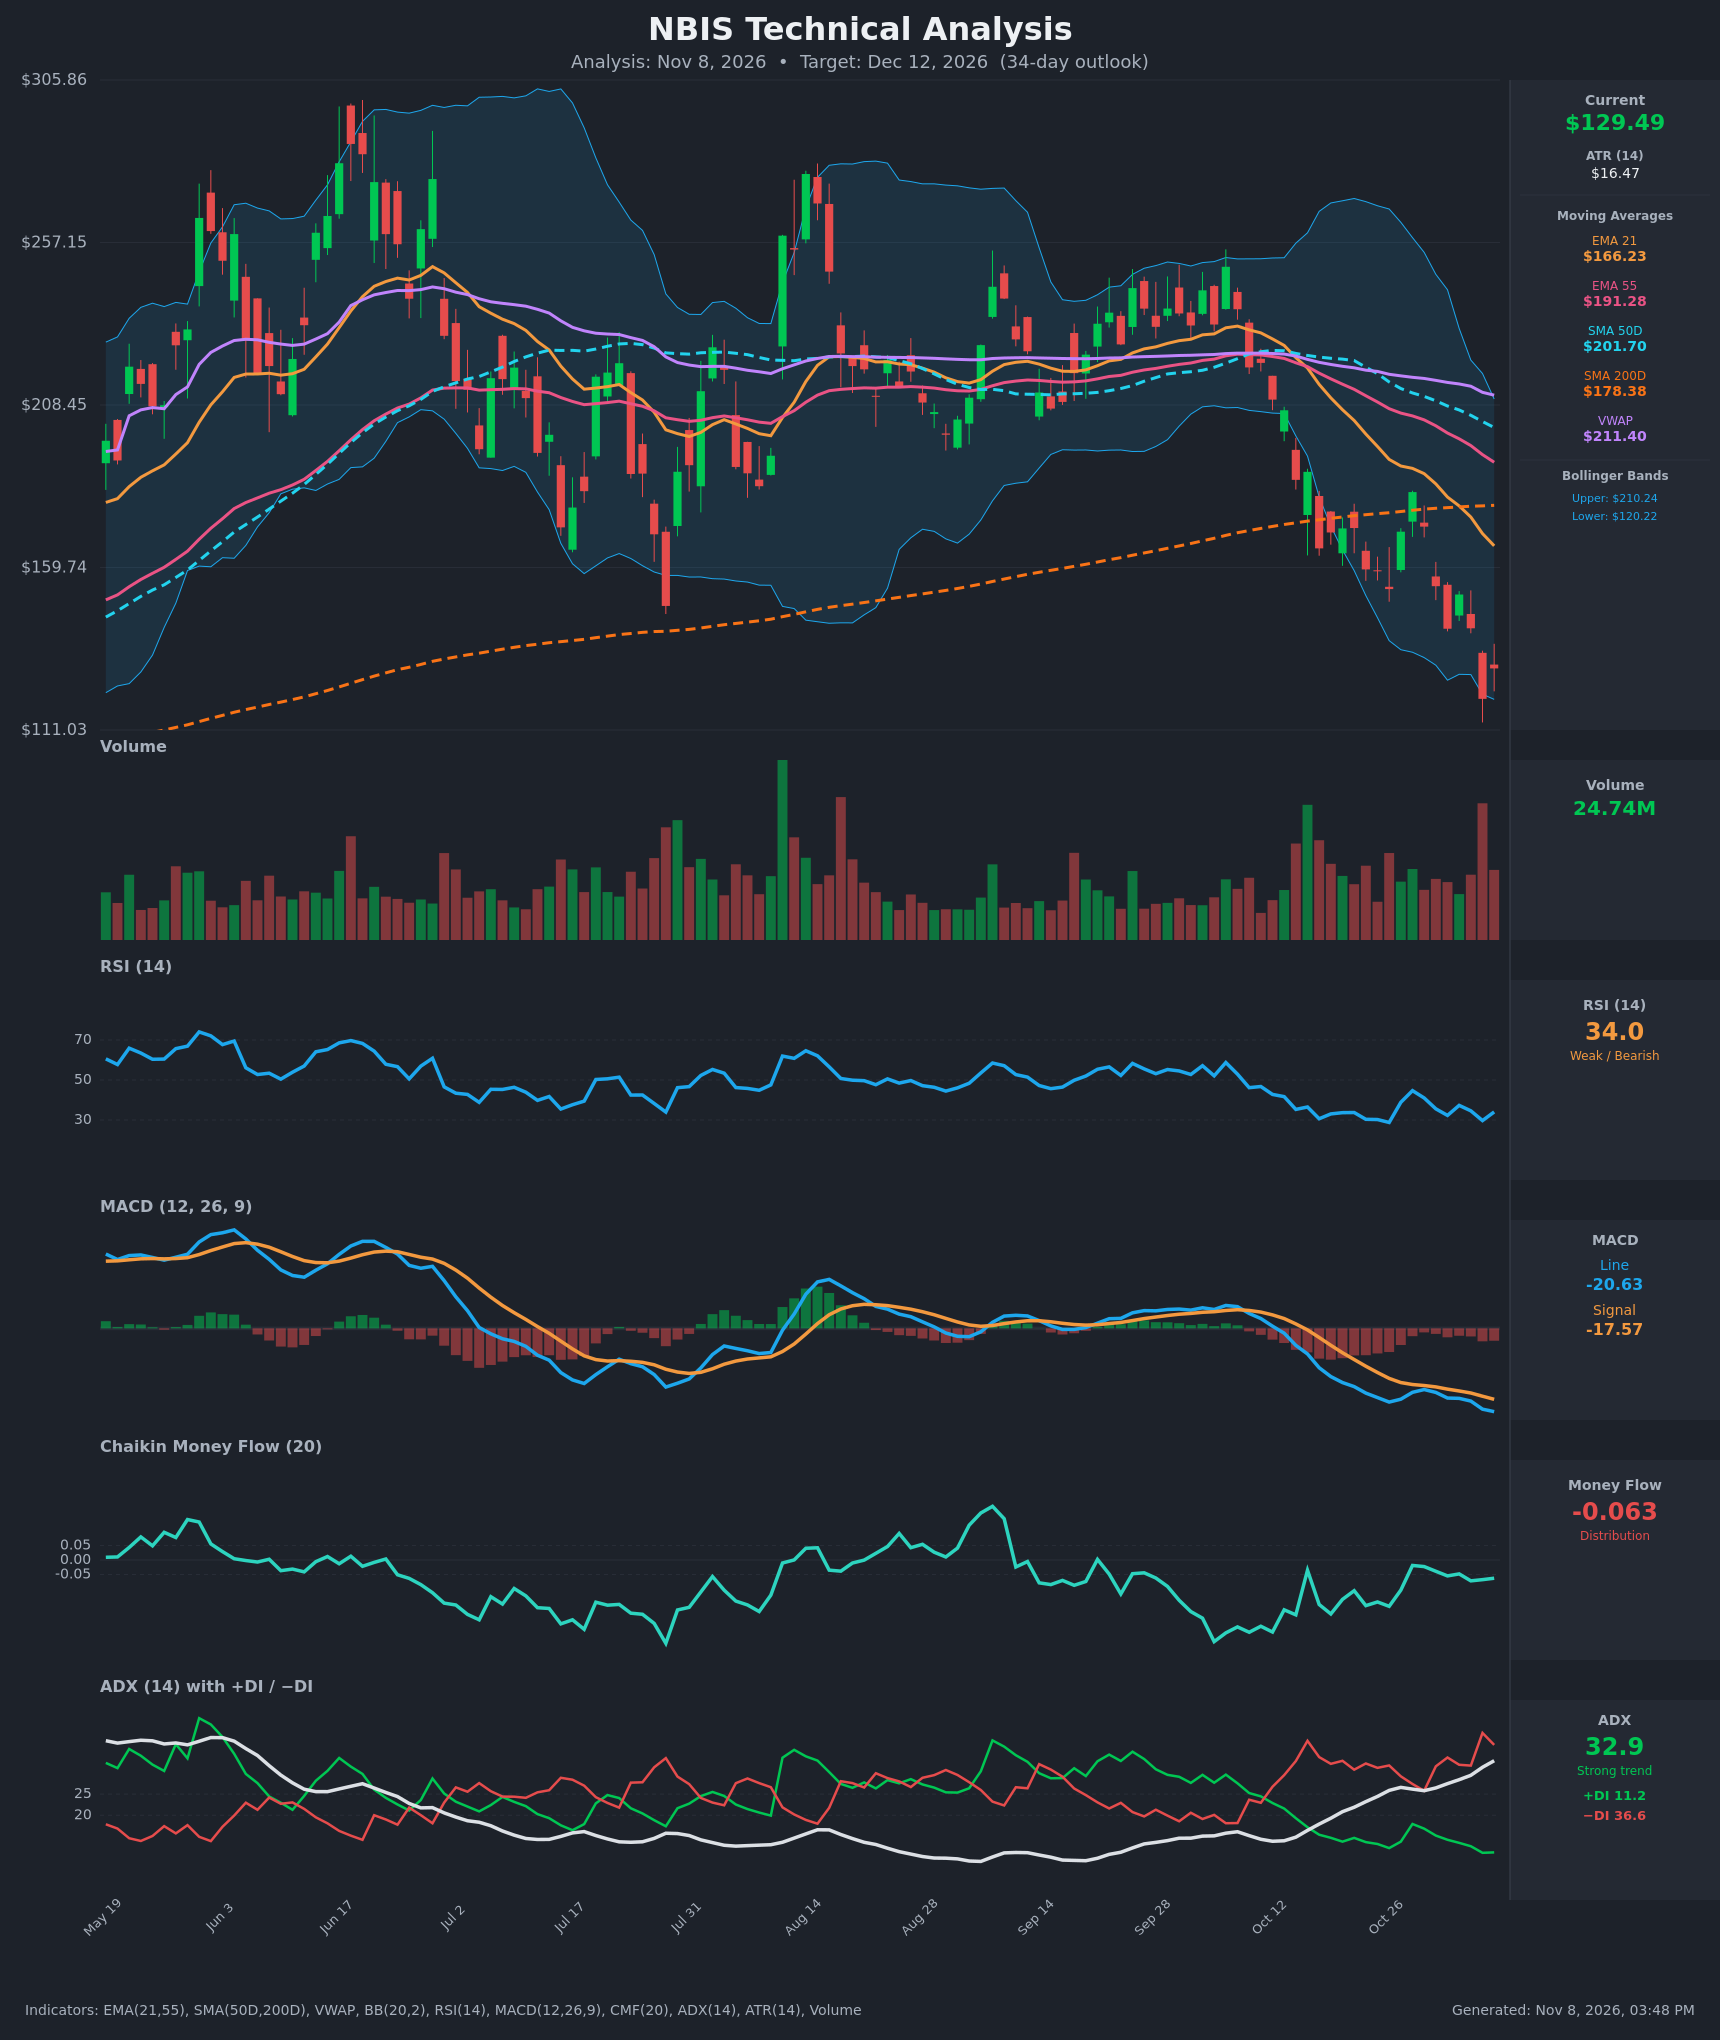
Analysis
TECHNICAL INDICATORS
- RSI (14): 34.03, down from the 40s in late October and bouncing off 29.7 on Nov 5. It is near oversold but has not made a sustained reversal, and the weak reading since mid-October reflects persistent selling pressure. [Bearish]
- 20 EMA (EMA 21 = $166.23): Price at $129.49 is about 22% below the EMA 21, which is falling steeply (from $210 to $166 in 14 bars). EMA 21 is also below EMA 55 ($191.28), so it acts as overhead resistance. [Bearish]
- MACD: Line -20.63 is below signal -17.57, and the gap is widening (histogram about -3.06). The bearish crossover happened in mid-October and momentum keeps making new lows. [Bearish]
- Bollinger Bands (20): Price at $129.49 is just above the lower band ($120.22). The Nov 5 close of $120.37 sat on the lower band. The bands are wide (upper $210.24) after the volatile selloff. Price is walking the lower band, which signals a strong downtrend, though a mean-reversion bounce is possible. [Bearish]
- CMF (20): -0.063, just below the -0.05 threshold. The reading is mildly negative and has improved from -0.186 on Oct 19, so distribution is easing but still present. [Distribution]
- ADX (14): 32.9 and rising (from 19.3). −DI at 36.6 is far above +DI at 11.2, so bears dominate. This is a strong, accelerating downtrend. [Strong Trend – Bearish]
- Volume: 24.74M, with heavy red-volume spikes on the recent breakdown days (Nov 5 especially). Selling volume is expanding on the declines, which confirms the downtrend. A tiny volume-backed bounce could be a capitulation signal, but it is not confirmed. [Bearish – distribution/capitulation risk]
DIVERGENCES & TRENDS
- No bullish RSI divergence yet: Price made a new low on Nov 5 ($120.37) and RSI hit 29.7, versus 28.8 on Oct 26 at a price of $153. RSI lows are roughly equal while price lows fell sharply, so there is a mild hidden strength in RSI. It is not a clean divergence, and it needs confirmation.
- MACD: Making new lows alongside price, so there is no divergence. Momentum confirms the trend.
- CMF: Improved from -0.186 to -0.063 while price fell, a mild positive divergence suggesting selling pressure is fading. It is still in distribution territory.
- Moving average structure: Price is below EMA 21, EMA 55, SMA 50D ($201.70) and SMA 200D ($178.38). EMA 21 is below EMA 55 (bearish alignment). SMA 50D is above SMA 200D, but the gap is narrowing quickly (SMA 200D rolling over from $178.38). SMA 200D has stopped rising, and a death cross is plausible within weeks. VWAP at $211.40 is far above price.
- Break: Price lost the SMA 200D around Oct 22 (from $171 to $159) and has extended below it. It broke the earlier ~$145-$150 range lows from July/August.
- ADX/DI: −DI has been above +DI since mid-October, with ADX rising through 25. This is a trend-confirmation signal.
CHART PATTERNS
- Primary: A Bearish Head and Shoulders / lower-high sequence is visible across the chart. The June peak (~$290) was followed by the August peak (~$270) and the September-October lower highs (~$240), with a neckline break around $160 in October. The distribution phase resolved into a downside breakdown, and the measured move targets the lower $100s.
- Secondary: A Bearish Flag/Pennant formed in late October (Oct 23-29 bounce to $182 and rejection), followed by the continuation drop to $120. This confirms the continuation pattern.
- Counter-pattern risk: The bottom is near the lower Bollinger Band with RSI around 30. A Bullish Falling Wedge-type reversal could form if volatility compresses, but nothing is confirmed yet.
- Targets: Pattern-implied measured moves point to the $100-$115 area. The recent low at $120.37 and the lower band at $120.22 are the immediate floor to watch.
POTENTIAL SCENARIOS
- Scenario 1: Bearish Trend Continuation — Price breaks the Nov 5 low ($120.37) with −DI dominant and MACD still deepening, and grinds lower to pattern-measured targets. Trigger: Daily close below $120. Target: $105-$112. Invalidation: Daily close above $152 (the Nov 3 level and EMA-zone resistance). (50% probability)
- Scenario 2: Neutral/Bullish Oversold Bounce and Range — RSI near 30 and CMF improvement spark a relief rally that stalls below the falling EMA 21 and the broken SMA 200D region, then fades back toward $125-$145. Trigger: Hold above $120 and reclaim $140. Target: $145-$155. Invalidation: Close below $118. (35% probability)
- Scenario 3: Bullish Reversal — Capitulation low is in, with a sharp V-shaped squeeze back toward the EMA 21 and the SMA 200D. Trigger: Daily close above $155 with volume expansion and RSI back above 50. Target: $166-$178. Invalidation: Failure at EMA 21 and a close below $128. (15% probability)
PRICE TARGETS
For the 34-day timeframe (to Dec 12, 2026): the trend is strongly bearish (ADX 32.9, −DI 36.6 vs +DI 11.2), but the price sits near the lower Bollinger Band with RSI close to oversold, so some bounce risk exists. The target is a modest drift lower, with a wide range given ATR of $16.47 and the high volatility.
- Target Price: $118.00 (for the 34-day timeframe)
- Expected Range: $98.00 to $142.00 (width $44, about 34% of current price; the 30-60 day guide is 12-18%, but elevated volatility, with ATR at 12.7% of price, justifies a wider range)
- Key Levels: Support at $120.37 (Nov 5 low and lower Bollinger Band), Resistance at $152.00 (Nov 3 level; EMA 21 at $166.23 is the next overhead hurdle)
OVERALL BIAS
OVERALL BIAS: BEARISH - Price is below all key moving averages, ADX is rising at 32.9 with −DI far above +DI, and MACD is widening below its signal line, all confirming the strong downtrend. Oversold conditions and a mild CMF improvement raise the odds of a relief bounce, but the trend favors lower prices over 34 days.
This is educational analysis and not financial advice.