NFLX 34-day bearish forecast — Nov 8, 2026
- Bias: Bearish
- Timeframe: 34 days (made Nov 8, 2026, target date Dec 11, 2026)
- Price at analysis: $63.41
- Price target: $60.80
- Expected range: $55.00 – $66.50
- Result: Pending — graded after the close on Dec 11, 2026
Get a free AI analysis of NFLX today
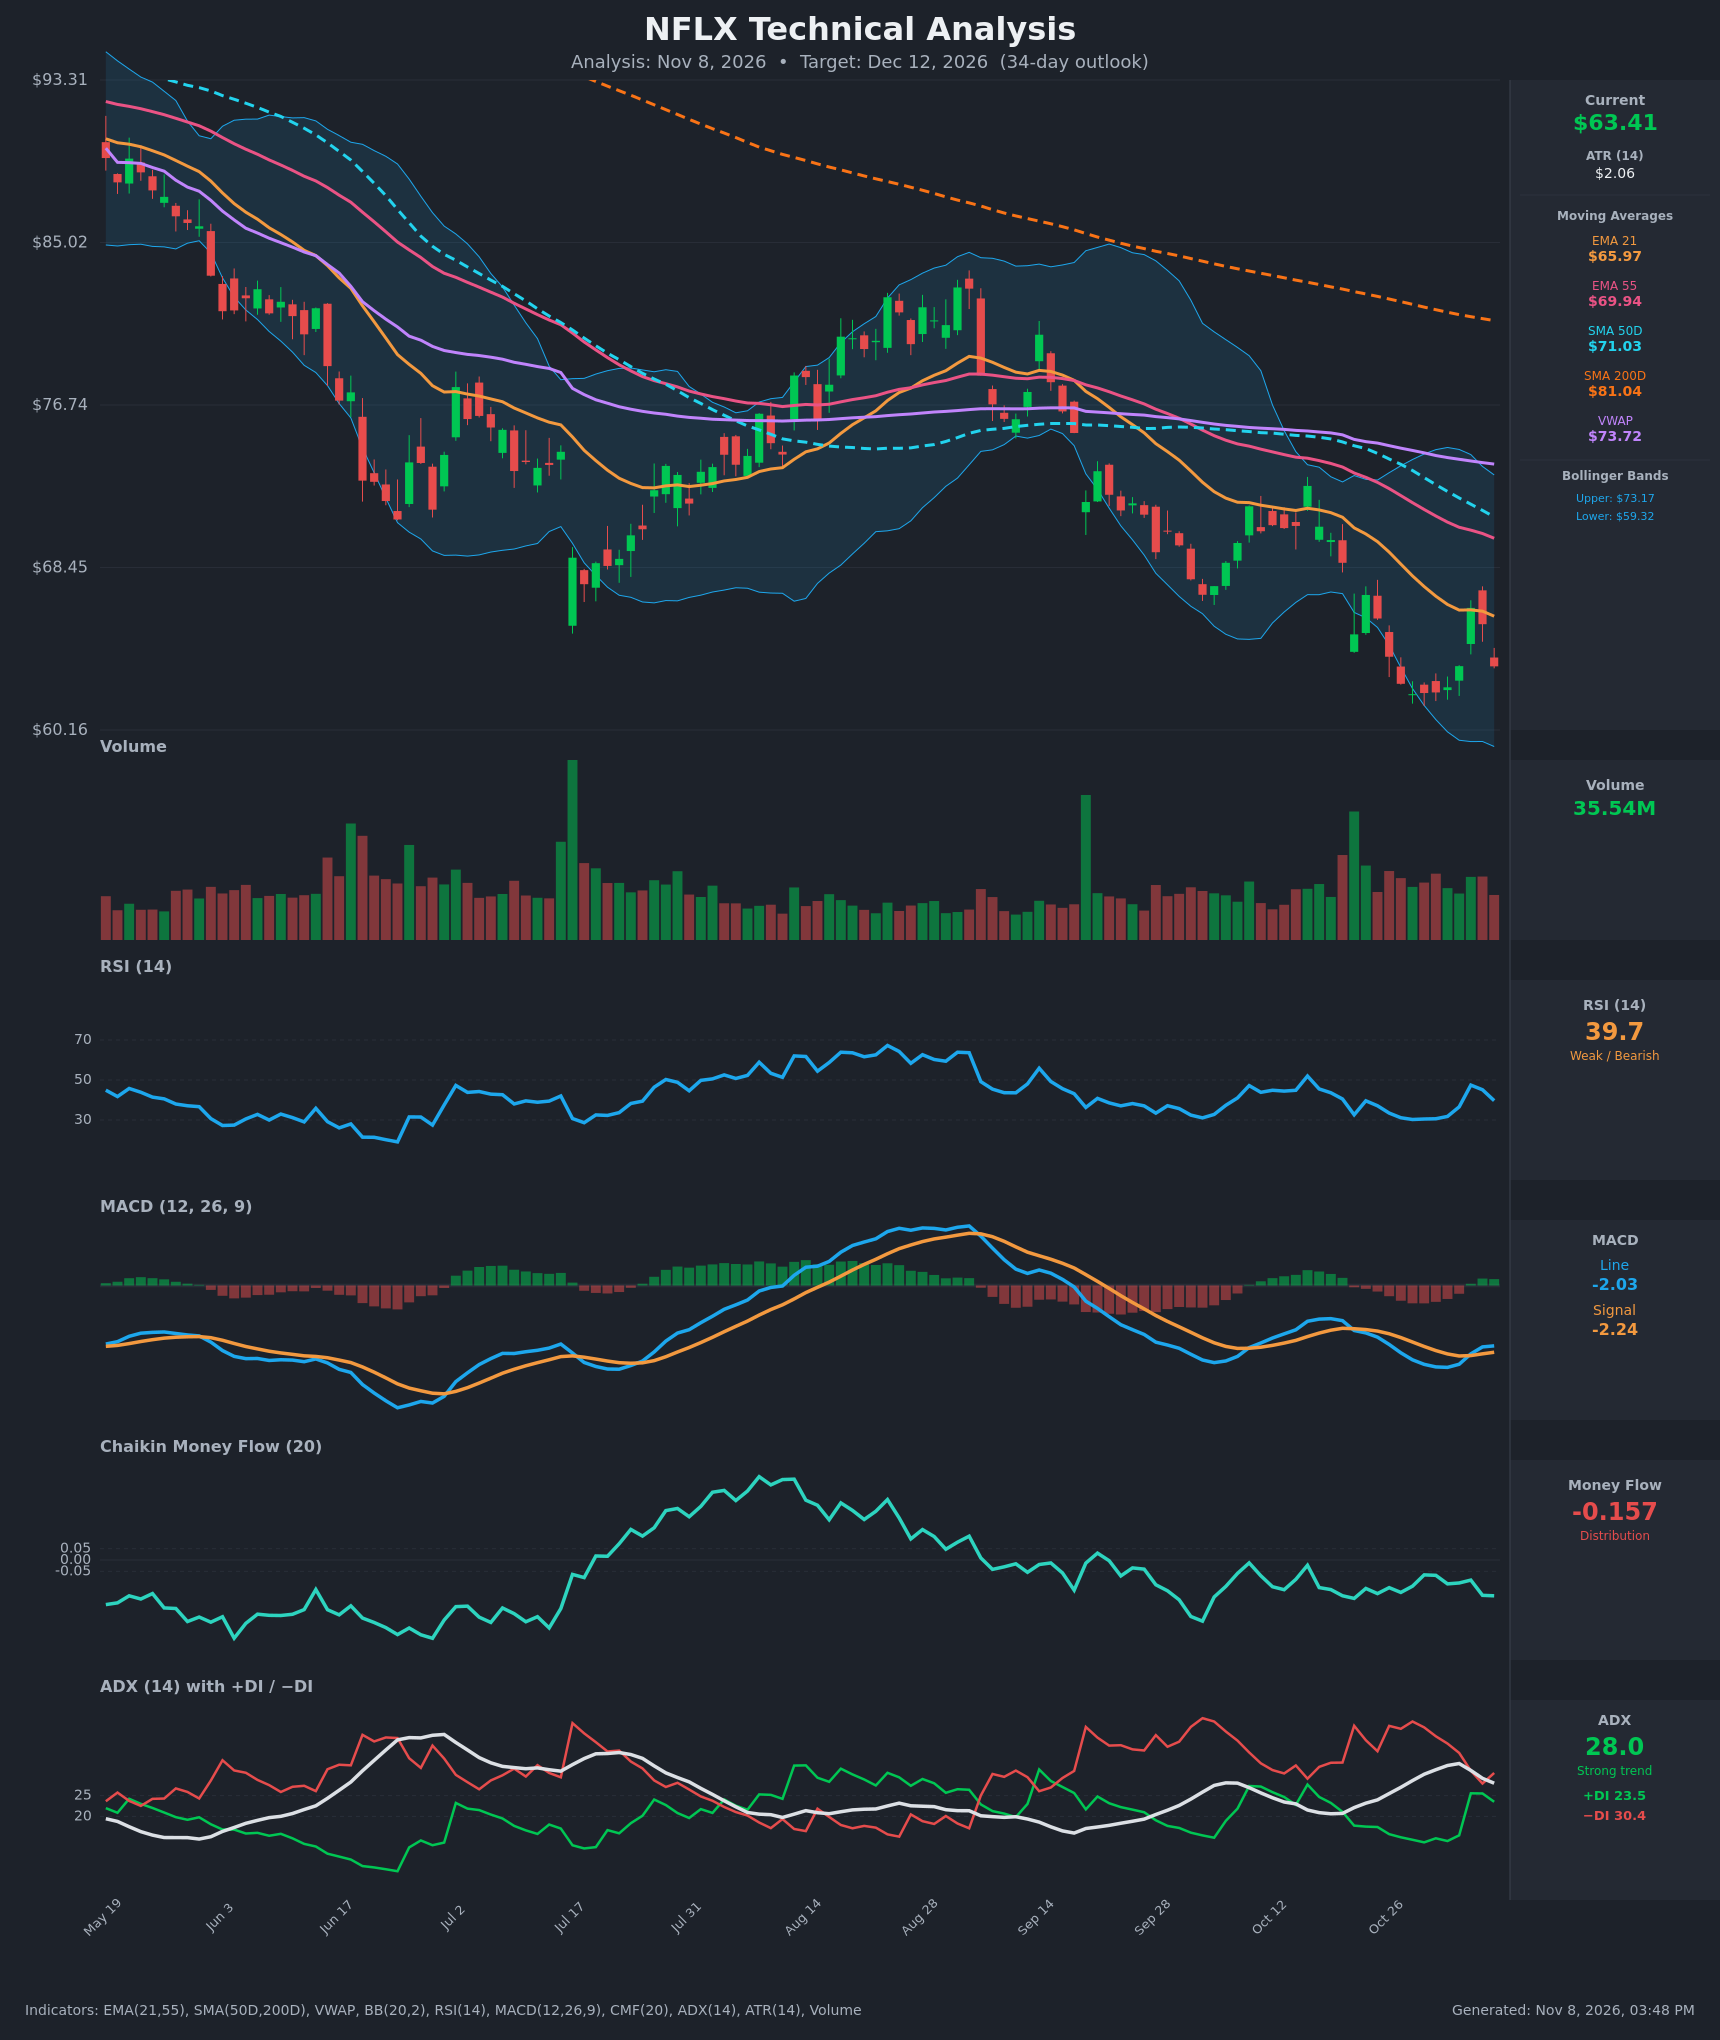
Analysis
TECHNICAL INDICATORS
- RSI (14): 39.68, below the 50 midline and off the Nov 4 spike to 47.5. It bottomed near 30 (Oct 28–30) and the bounce failed below 50. Momentum is weak but not oversold. [Bearish]
- 20 EMA: The 21 EMA is $65.97 and price ($63.41) is below it, so it acts as resistance. The EMA21 is also below the EMA55 ($69.94), a bearish stack that is still widening. [Bearish]
- MACD: The line (-2.03) is slightly above the signal (-2.245) after a crossover on Nov 4, and the histogram is small and positive. Both lines are deep below zero, so this is a minor relief signal inside a downtrend. [Neutral]
- Bollinger Bands (20): Upper $73.17, lower $59.32, midline about $66.25. Price is in the lower half, about $4 above the lower band. The bands are wide, and the midline is falling and capping rallies. [Bearish]
- CMF (20): -0.157, well below -0.05 and negative for the whole visible window. This is persistent distribution, and the bounce showed no accumulation. [Distribution]
- ADX (14): 28.0 with -DI (30.4) above +DI (23.5). ADX is above 25, so the trend is strong. It has eased from 32.7, and the +DI/−DI gap has narrowed from the Nov 4–5 bounce. [Strong Trend – Bearish]
- Volume: 35.54M, around average with no clear expansion on the bounce. There was heavy volume on the selloff days in late Oct. The bounce lacks volume confirmation, while the selling pressure was heavy. [Bearish bias, no accumulation]
DIVERGENCES & TRENDS
- Death cross: The SMA50D ($71.03) is below the SMA200D ($81.04), and both are declining. Price is below all moving averages and VWAP ($73.72), a classic long-term downtrend.
- MACD vs. price: MACD made a higher low (-2.75 vs. a price low of $61.99) while price held near the lows. This is a mild positive divergence, but it is not confirmed because the MACD is still negative.
- RSI: RSI hit about 30 at the late-Oct lows, so the stock was oversold. Its failure at 47.5 shows sellers still dominate rallies.
- Lower highs: Price has made lower highs from $69.85 to $66.39 and now $65.56. Support near $62 has been tested three times.
- DI: −DI has stayed above +DI except for the brief Nov 4–5 narrowing. Bears remain in control.
CHART PATTERNS
- Descending triangle / Bearish Pennant (continuation): There are lower highs ($69.85 → $66.39) against a flat support zone around $62. A break below $61.90 would confirm the pattern. The measured move is the pattern height of about $5–7, which points to about $55–57.
- Possible Bullish Double/Triple Bottom (reversal): Closes of $61.99, $62.05 and $62.08 form a tight base. It would need a close above about $66.4 and then the 21 EMA to be taken seriously, and so far it has failed there.
- The bearish pennant/descending-triangle read has more evidence behind it than the base.
POTENTIAL SCENARIOS
- Scenario 1: Bearish Support Breakdown — The $62 base fails and the downtrend resumes, with the death-cross structure, distribution and −DI dominance all supporting it. Trigger: daily close below $61.90 on rising volume. Target: $57–$59 (lower BB near $59.32), with an extension to $55. Invalidation: close above $66.40 (EMA21). (50% probability)
- Scenario 2: Bullish Oversold Relief Rally — The MACD crossover and the triple base near $62 spark a rebound toward the declining moving averages. Trigger: close above $66.40 with volume and CMF improving. Target: $69–$70 (EMA55 and BB midline area). Invalidation: close below $61.90. (30% probability)
- Scenario 3: Neutral Range Chop — Price oscillates between $60 and $66.50 as momentum fades. Trigger: ADX falls below 22 with price pinned between support and the EMA21. Target: $62–$65. Invalidation: a decisive close outside the range. (20% probability)
PRICE TARGETS
- Target Price: $60.80 (34-day)
- Expected Range: $55.00 to $66.50 (width $11.50, about 18.1% of current price, consistent with the 30–60 day guidance of 12–18%)
- Key Levels: Support at $61.90 (then $59.32 lower Bollinger Band), Resistance at $65.97 (EMA21, then $69.94 EMA55)
OVERALL BIAS
OVERALL BIAS: BEARISH - Price is below every major moving average with a death cross in place. CMF shows persistent distribution, −DI leads with ADX above 25, and rallies keep failing at the falling EMA21. The minor MACD crossover and the $62 base offer only a modest bounce chance.
This is educational analysis and not financial advice.