NOK 34-day bearish forecast — Nov 8, 2026
- Bias: Bearish
- Timeframe: 34 days (made Nov 8, 2026, target date Dec 11, 2026)
- Price at analysis: $7.66
- Price target: $7.20
- Expected range: $6.60 – $7.90
- Result: Pending — graded after the close on Dec 11, 2026
Get a free AI analysis of NOK today
Analysis
TECHNICAL INDICATORS
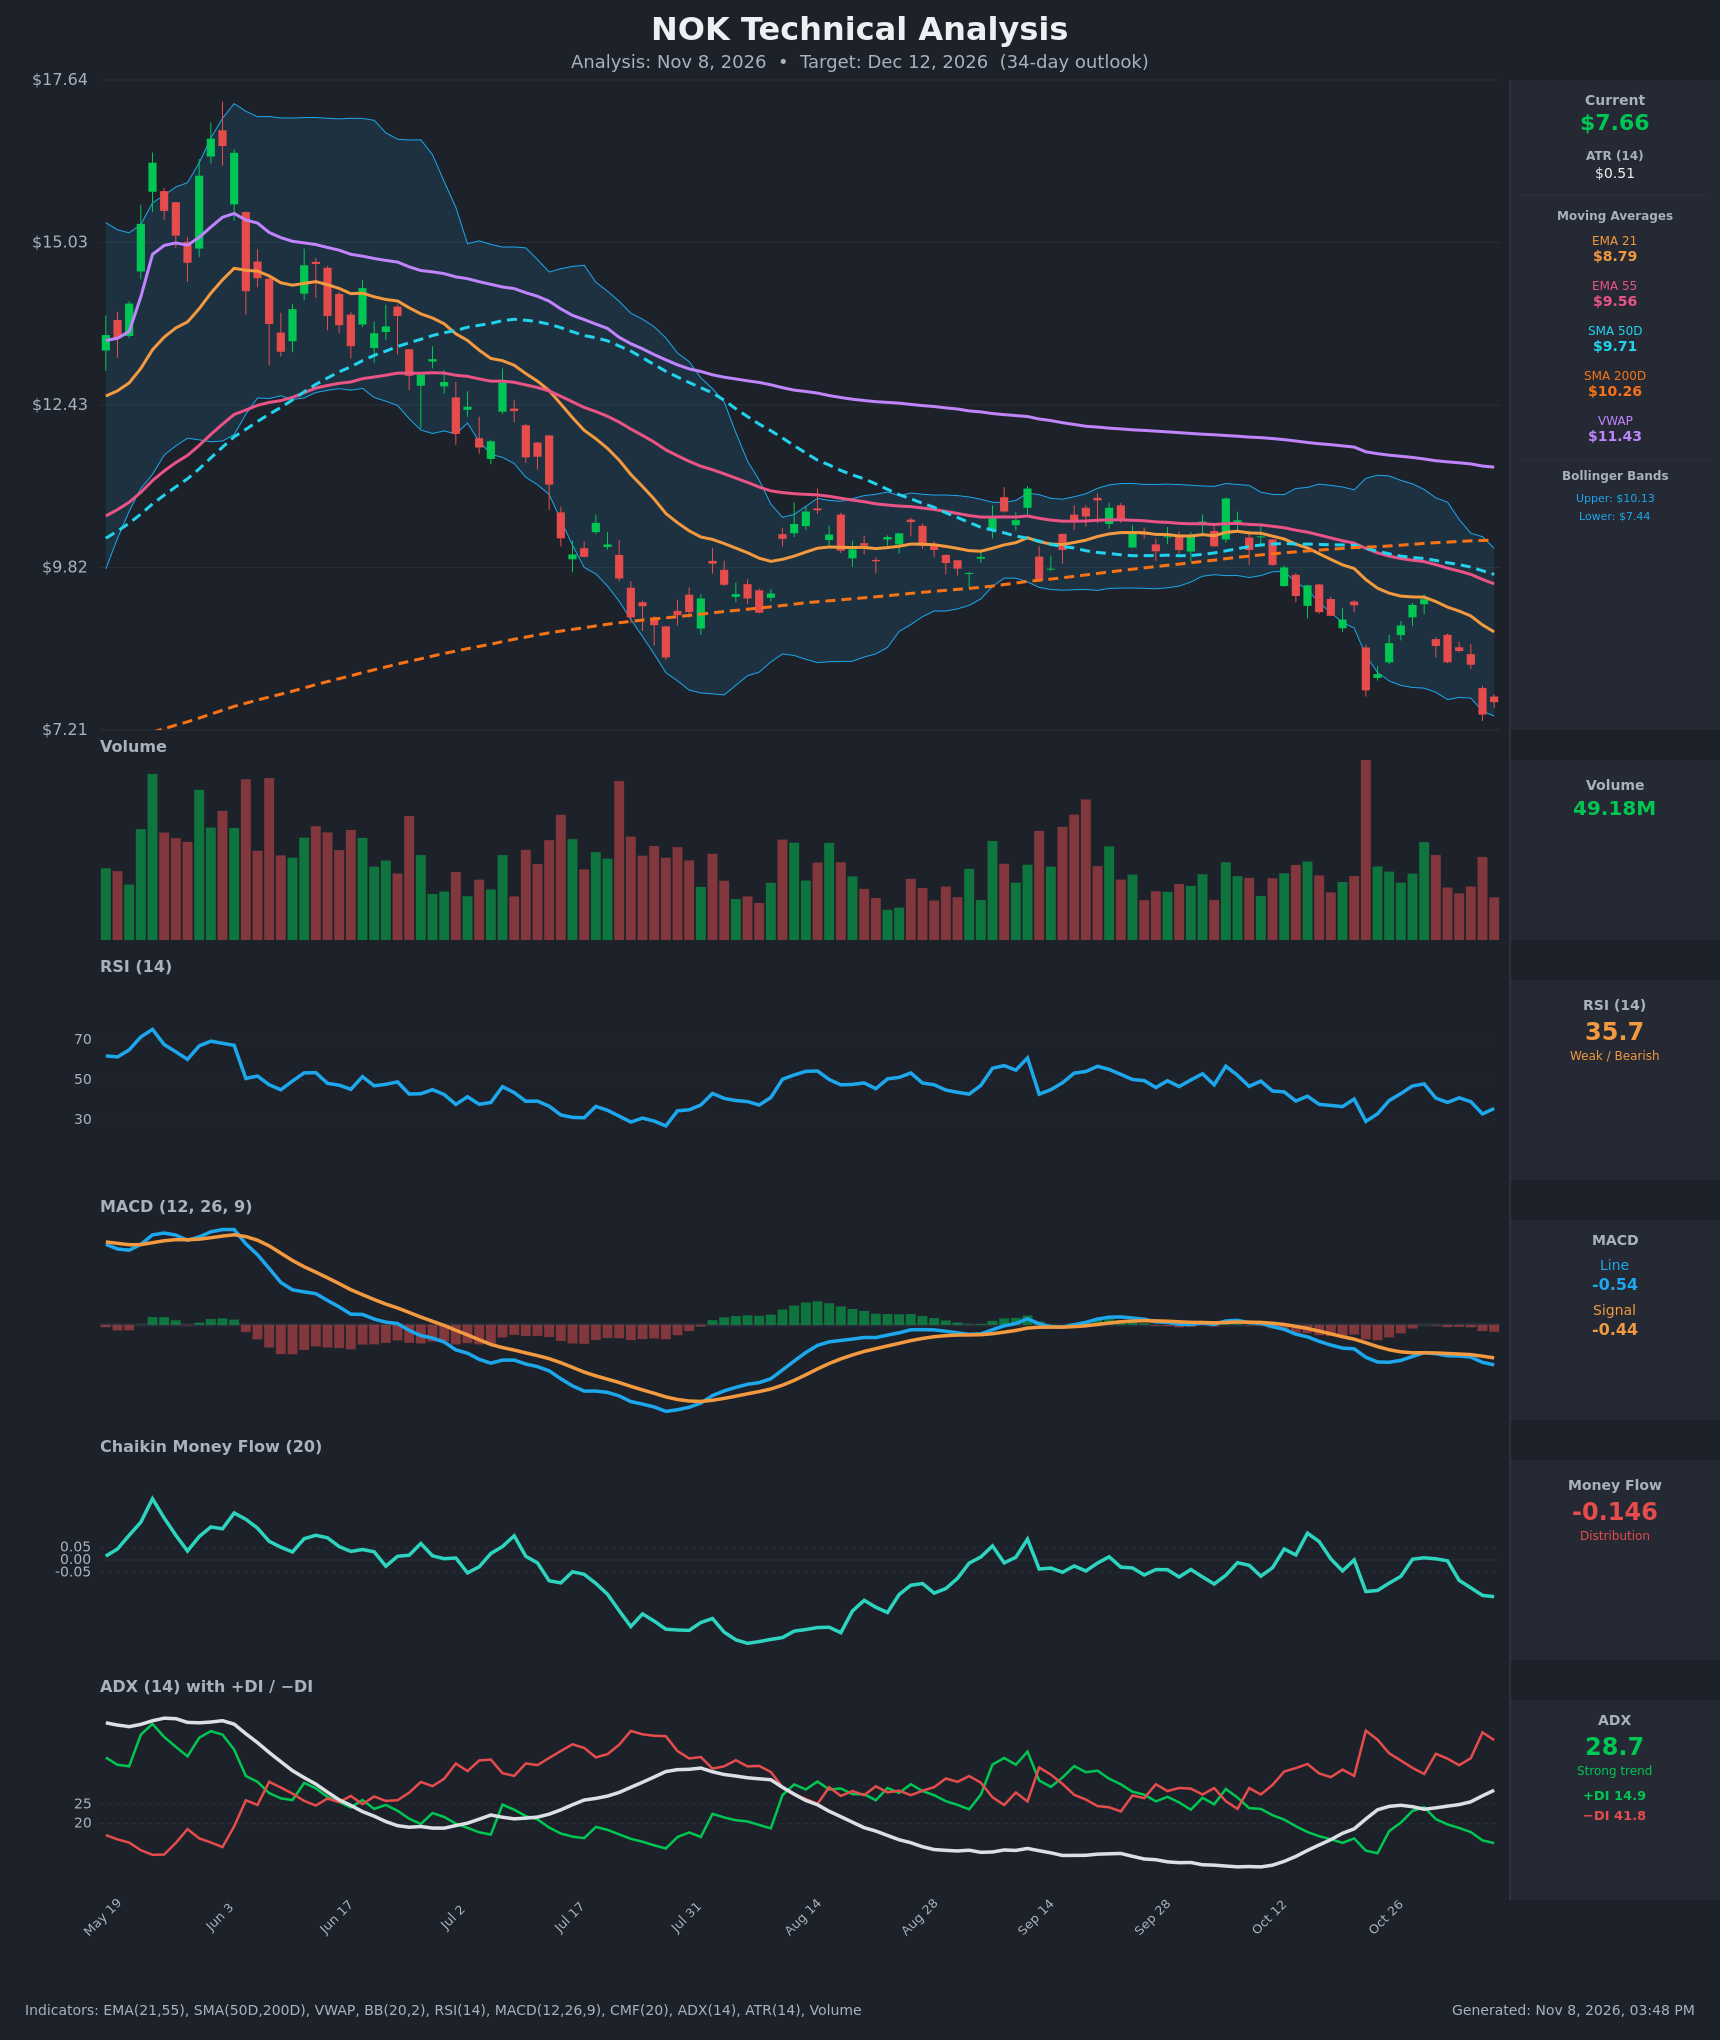
- RSI (14): 35.75, weak but not oversold. It has made lower highs (48 on Oct 29, 41 on Nov 3, 36 now) and touched 29 on Oct 22, so momentum is still pointing down. [Bearish]
- 20 EMA (21 EMA used): $8.79, with price at $7.66 about 13% below it. The EMA is falling steeply, from $9.95 to $8.79 in 15 bars, and acts as overhead resistance. The EMA21 is also below the EMA55 ($9.56), so there is no bullish crossover. [Bearish]
- MACD: Line -0.535 is below Signal -0.442, and the histogram is negative at about -0.09 and widening. The bearish crossover occurred around Oct 30, and the line is making new lows after a brief flattening. [Bearish]
- Bollinger Bands (20): Upper $10.13, lower $7.44, so price sits just above the lower band in the bottom ~8% of the range. This shows a persistent downtrend with price riding the lower band. It also leaves some risk of a mean-reversion bounce. [Bearish]
- CMF (20): -0.146, well below -0.05 and falling from roughly 0 in late October. Selling pressure is intensifying. [Distribution]
- ADX (14): 28.7 and rising, with −DI at 41.8 far above +DI at 14.9. The downtrend is strong and bears are firmly in control. [Strong Trend – Bearish]
- Volume: 49.18M, around average, with no capitulation spike. The heaviest recent volume came on the Oct 22 gap-down, and rebounds came on lighter volume. This indicates selling is not exhausted. [Bearish-leaning / no capitulation]
DIVERGENCES & TRENDS
- Divergences: There is no bullish RSI or MACD divergence. Price made a new low at $7.46 on Nov 5 and RSI (33) and MACD both confirmed with lower lows, so there is no reversal evidence yet.
- Moving averages: The SMA50D ($9.71) crossed below the SMA200D ($10.26) around Oct 22, a death cross. Price is below the SMA200D, SMA50D, EMA21, EMA55 and VWAP ($11.43). This is a fully bearish stack.
- Trend of indicators: ADX has climbed from 15.8 to 28.7 while −DI stays above 40, so the trend is strengthening. CMF is making lower lows.
- Rebounds: The bounce from $7.85 to $9.31 (Oct 22–29) failed at the falling EMA21. Rebounds are being sold.
CHART PATTERNS
- Bearish flag / failed rebound (continuation): The Oct 22 gap-down was followed by a corrective rebound to ~$9.31 and then a rollover. The break of the $8.26–8.30 area and the new low at $7.46 resemble the bearish flag breakdown from the reference diagram. The measured move of the ~$1.4 drop points to roughly $6.60–7.00.
- Descending channel: Lower highs ($10.5 → $9.3) and lower lows ($7.85 → $7.46) form a clear downward sequence. This is a bearish continuation structure.
- Caveat: Price is hugging the lower Bollinger Band, so a short-term oversold bounce toward $8.30–8.80 is plausible before any further decline.
POTENTIAL SCENARIOS
- Scenario 1: Bearish Trend Continuation — The strong ADX, the −DI dominance, the death cross and the CMF distribution favor further downside. Rallies fade at the falling EMA21. Trigger: daily close below $7.40 (the Nov 5 low and lower BB). Target: $7.00 initially, then $6.60. Invalidation: daily close above $8.80 (EMA21). (55% probability)
- Scenario 2: Bullish Oversold Bounce — Price at the lower band with RSI in the mid-30s could squeeze toward the EMA21 and prior breakdown area. Trigger: reclaim of $8.30 with a rising RSI above 45 and a CMF turn toward zero. Target: $8.80–$9.20. Invalidation: close back below $7.40. (30% probability)
- Scenario 3: Neutral Basing Range — Price chops between $7.20 and $8.30 as selling slows. Trigger: low-volume consolidation holding $7.25. Target: ~$7.60–$7.90. Invalidation: close outside the range. (15% probability)
PRICE TARGETS
- Target Price: $7.20 (34-day)
- Expected Range: $6.60 to $7.90 (width $1.30 ≈ 17% of the current price, consistent with the 30–60 day guidance)
- Key Levels: Support at $7.25 (recent low area), Resistance at $8.79 (EMA21)
OVERALL BIAS
OVERALL BIAS: BEARISH - Price is below every moving average after a death cross, the MACD is below its signal line with a widening negative histogram, CMF shows distribution, and ADX of 28.7 with −DI at 41.8 confirms a strong downtrend. The main risk is an oversold bounce from the lower Bollinger Band.
This is educational analysis and not financial advice.