ORCL 34-day bearish forecast — Nov 8, 2026
- Bias: Bearish
- Timeframe: 34 days (made Nov 8, 2026, target date Dec 11, 2026)
- Price at analysis: $116.10
- Price target: $110.50
- Expected range: $101.00 – $121.00
- Result: Pending — graded after the close on Dec 11, 2026
Get a free AI analysis of ORCL today
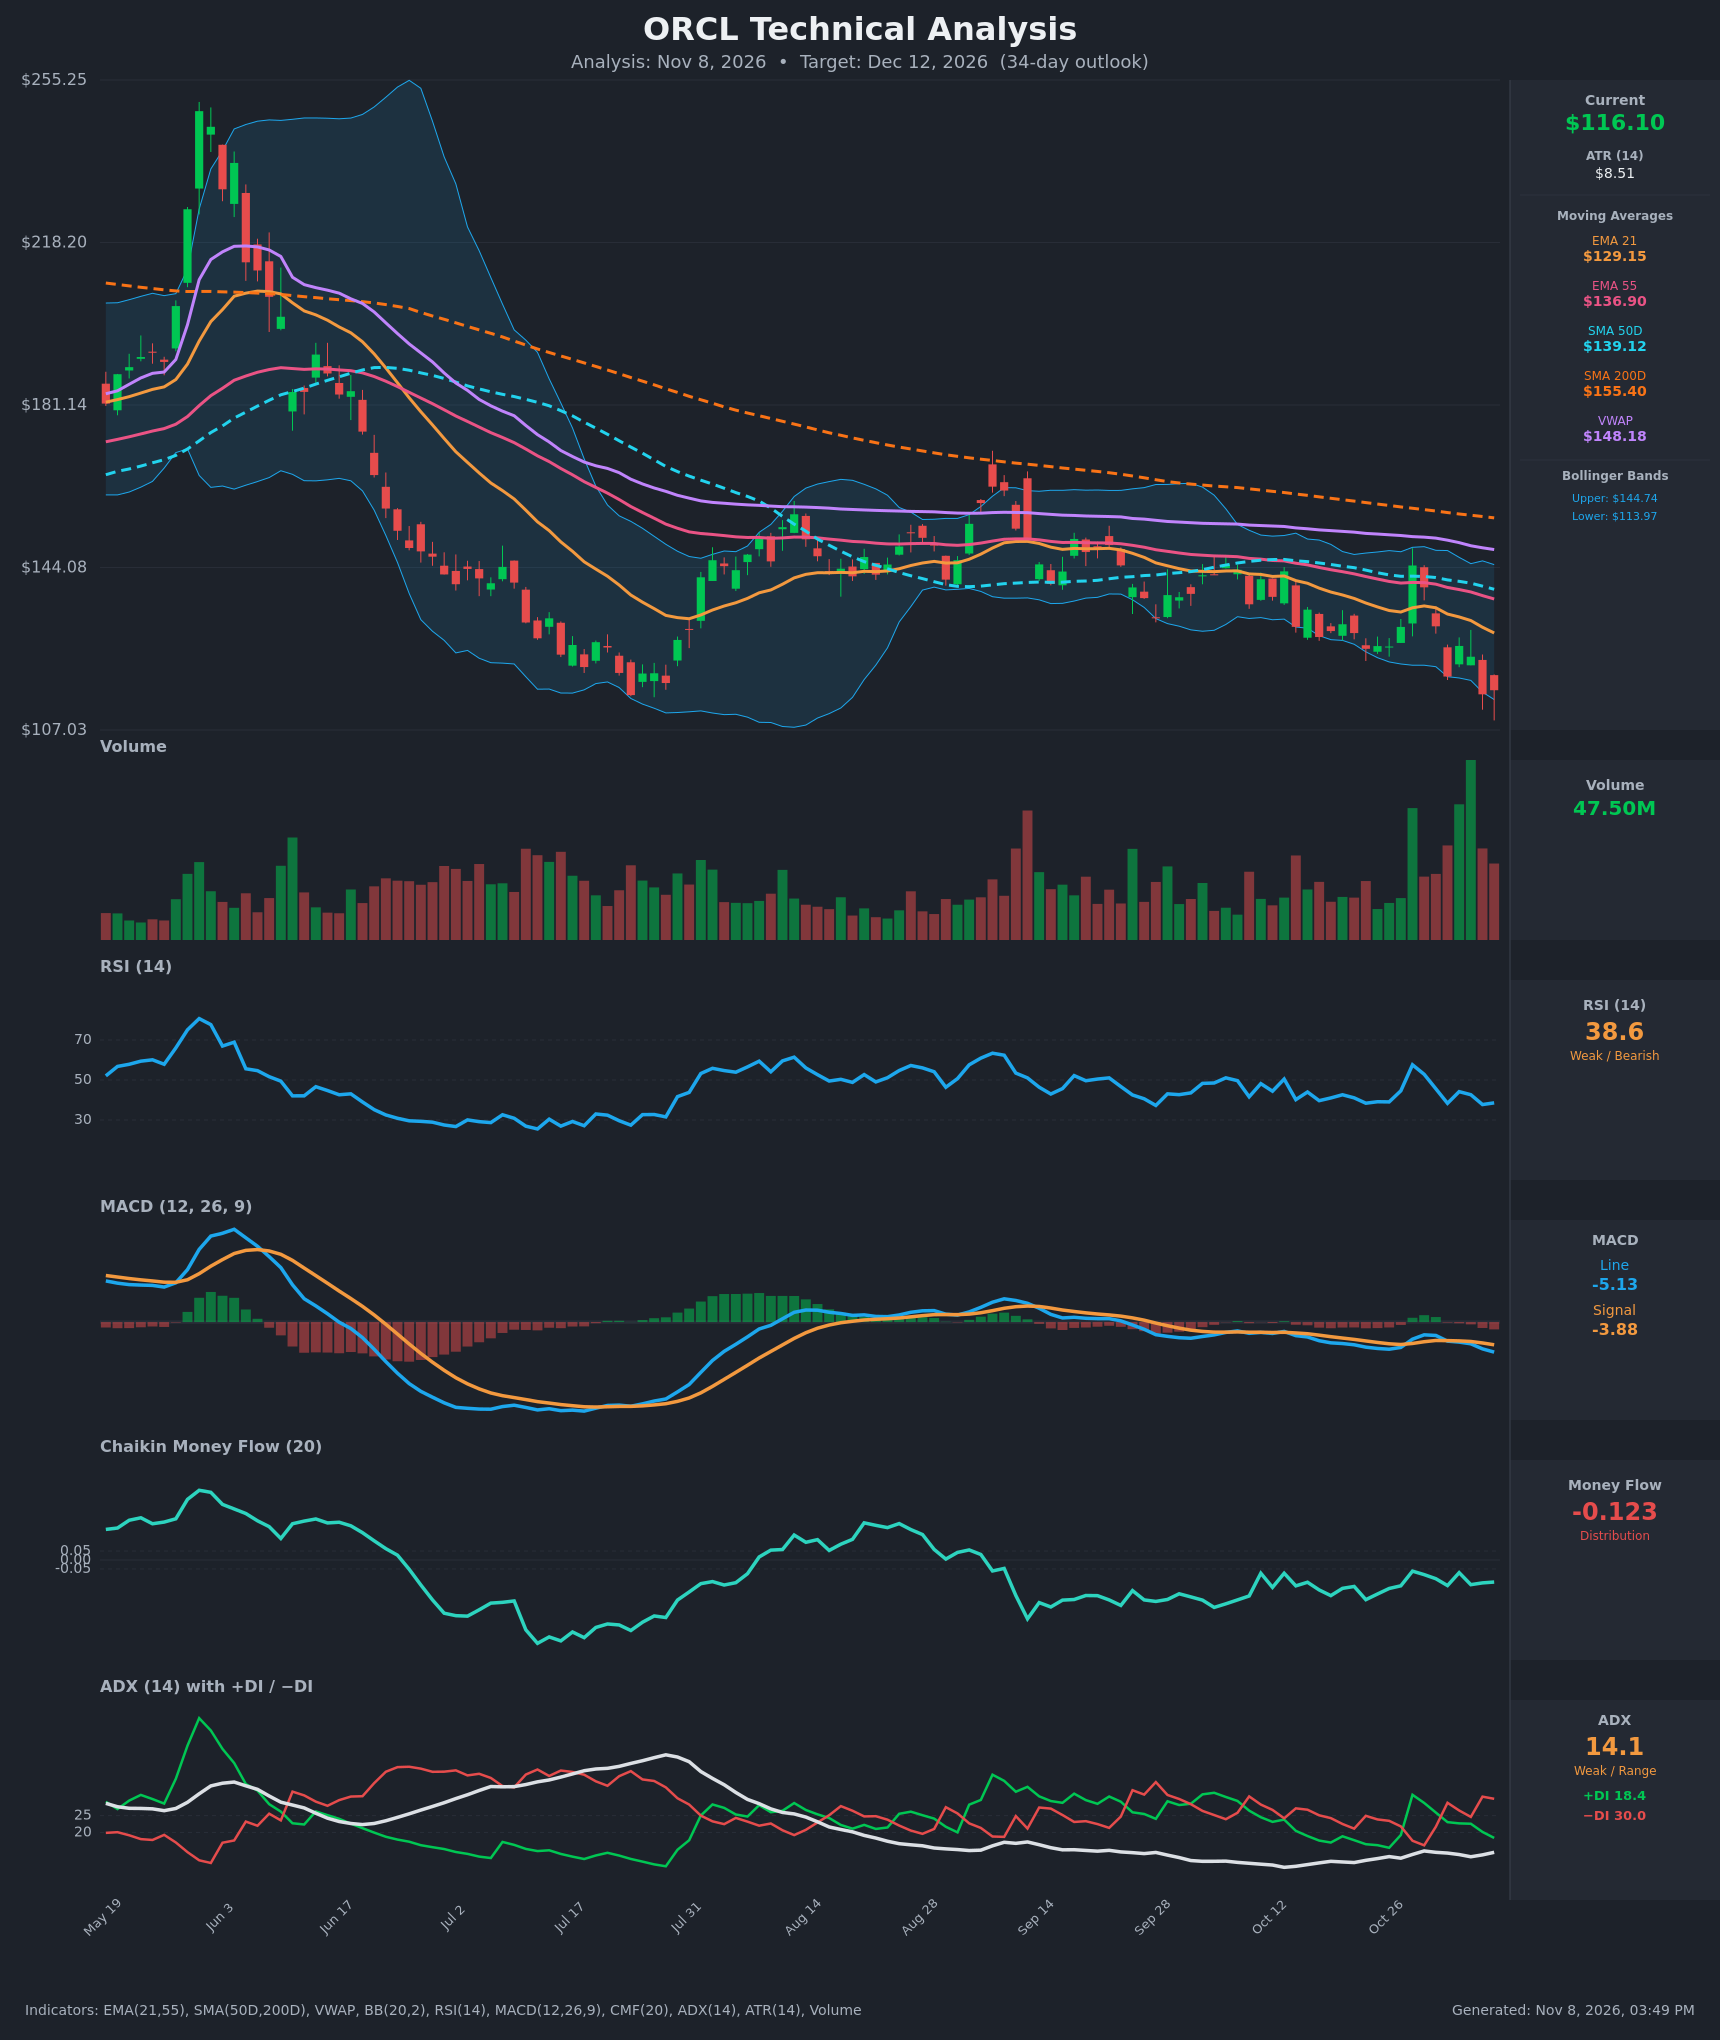
Analysis
TECHNICAL INDICATORS
- RSI (14): 38.56, below the 50 midline but not oversold (<30). It has made lower highs since the Oct 28 spike to 57.6 and is rolling over. This leaves room for further downside before an oversold bounce. [Bearish]
- 20 EMA: The 21 EMA is $129.15 and price at $116.10 is about 10% below it. The EMA is falling steadily (138.49 → 129.15 in 15 bars), so it acts as overhead resistance. EMA21 is also below EMA55 ($136.90), a bearish stack. [Bearish]
- MACD: Line -5.13 is below signal -3.88, with the histogram at about -1.25 and widening. A bearish crossover occurred on Nov 2 (-3.255 vs -3.165), and the gap has grown since. The line is making new lows for the move. [Bearish]
- Bollinger Bands (20): Upper $144.74, lower $113.97, midline roughly $129.4. Price sits in the lower quarter of the bands, about $2 above the lower band. Bands are mildly expanding to the downside, and the chart shows price walking the lower band. This is a trend-pressure signal, though a lower-band test can also trigger a short-term bounce. [Bearish]
- CMF (20): -0.123, below the -0.05 threshold, and negative for the entire recent window (range -0.06 to -0.22). This is persistent distribution, so rallies have been sold. [Distribution]
- ADX (14): 14.1, which is weak (<20), with −DI 30.0 above +DI 18.4. The direction is clearly bearish, but trend strength is low, so a drift or choppy decline is more likely than a waterfall. ADX is ticking up from ~11, and −DI has re-widened its lead. [Weak Trend, bearish direction]
- Volume: 47.5M is well above the earlier baseline. The huge Oct 28 gap-up bar (close $144.54) was fully erased within about 6 sessions, a classic failed breakout / bull trap. The recent heavy volume has come on red candles (Nov 2, Nov 5). [Bearish – high-volume distribution]
- Moving averages / VWAP: Price is below the 21 EMA ($129.15), 55 EMA ($136.90), SMA50 ($139.12), SMA200 ($155.40) and VWAP ($148.18). A death cross (SMA50 under SMA200) is already in place, and every average is sloping down. [Bearish]
DIVERGENCES & TRENDS
- No bullish divergence yet. Price made a new low near $115 on Nov 5, and RSI (37.7) and MACD (-4.58) both made fresh lows with it. Momentum is confirming the price decline.
- Lower highs. The Oct 28 spike peaked at $144.54, below the Sept highs of ~$150, and the sell-off since has retraced the whole move.
- MACD crossed bearishly on Nov 2 and is accelerating below zero.
- −DI/+DI: the Oct 28 bullish DI cross (+DI 31 vs −DI 17.5) was short-lived. −DI retook control on Oct 30 and has widened to a 12-point lead.
- CMF has been below zero since early September and has not recovered, so buyers have not stepped in.
- ADX at 14 is the main counterweight. Without trend strength, a relief bounce toward the 21 EMA remains possible.
CHART PATTERNS
- Primary: bearish continuation (stair-step downtrend / descending-channel behavior). The lower highs and lower lows since June form a persistent downtrend. The Oct 28 spike failed at the declining SMA50/EMA55 zone, which is consistent with a bearish pennant/flag-style continuation. A breakdown below the $113–115 area projects toward the $107 low and beyond.
- Alternative: bullish double bottom. Price is retesting the July–August lows (~$114–116). If this zone holds and price rallies above the interim swing high near $126–131, it would resemble a Bullish Double Bottom with a measured move toward $135–145. Nothing confirms this yet: there is no divergence, and volume and CMF are bearish.
- Significance: the $113–115 zone is the key decision point. A hold produces a bounce, and a break opens the way to the $100–107 area.
POTENTIAL SCENARIOS
- Scenario 1: Bearish Support Breakdown & Continuation — Price fails to hold the lower Bollinger Band and prior July lows, with the 21 EMA and falling averages capping any bounce. Persistent distribution and −DI dominance keep pressure on. Trigger: daily close below $113.97, then below $110. Target: $107 first, then $100–105. Invalidation: daily close above $129 (21 EMA). (50% probability)
- Scenario 2: Bullish Double-Bottom Relief Bounce — Price holds the $113–115 prior support, RSI forms a higher low, and shorts cover toward the mean. Trigger: close above $123.73 and then $126.19 on rising volume with a MACD histogram turn. Target: $129 (21 EMA), potentially $136–137 (EMA55). Invalidation: close below $112. (35% probability)
- Scenario 3: Neutral Range Chop — ADX remains below 20 and price oscillates between about $110 and $124 with no resolution. Trigger: failed breaks on both sides. Target: $112–120. Invalidation: close outside $107–$129. (15% probability)
PRICE TARGETS
- Target Price: $110.50 (34-day)
- Expected Range: $101.00 to $121.00 (width $20 ≈ 17.2% of current price, in line with the 12–18% guidance for 30–60 days, and with ATR ≈ $8.51 at 34 days)
- Key Levels: Support at $113.97 (lower Bollinger Band, with $107.03 as the next major low), Resistance at $129.15 (21 EMA)
OVERALL BIAS
OVERALL BIAS: BEARISH - Price is below every moving average with a death cross in place, MACD is in a widening bearish crossover, −DI leads +DI, and CMF shows persistent distribution. The failed Oct 28 breakout on heavy volume adds to the bearish case. Weak ADX and the nearby prior-support zone ($113–115) keep conviction modest, with relief-bounce risk toward $129.
This is educational analysis and not financial advice.