RKLB 34-day bearish forecast — Nov 8, 2026
- Bias: Bearish
- Timeframe: 34 days (made Nov 8, 2026, target date Dec 11, 2026)
- Price at analysis: $53.07
- Price target: $50.50
- Expected range: $45.50 – $58.50
- Result: Pending — graded after the close on Dec 11, 2026
Get a free AI analysis of RKLB today
Analysis
TECHNICAL INDICATORS
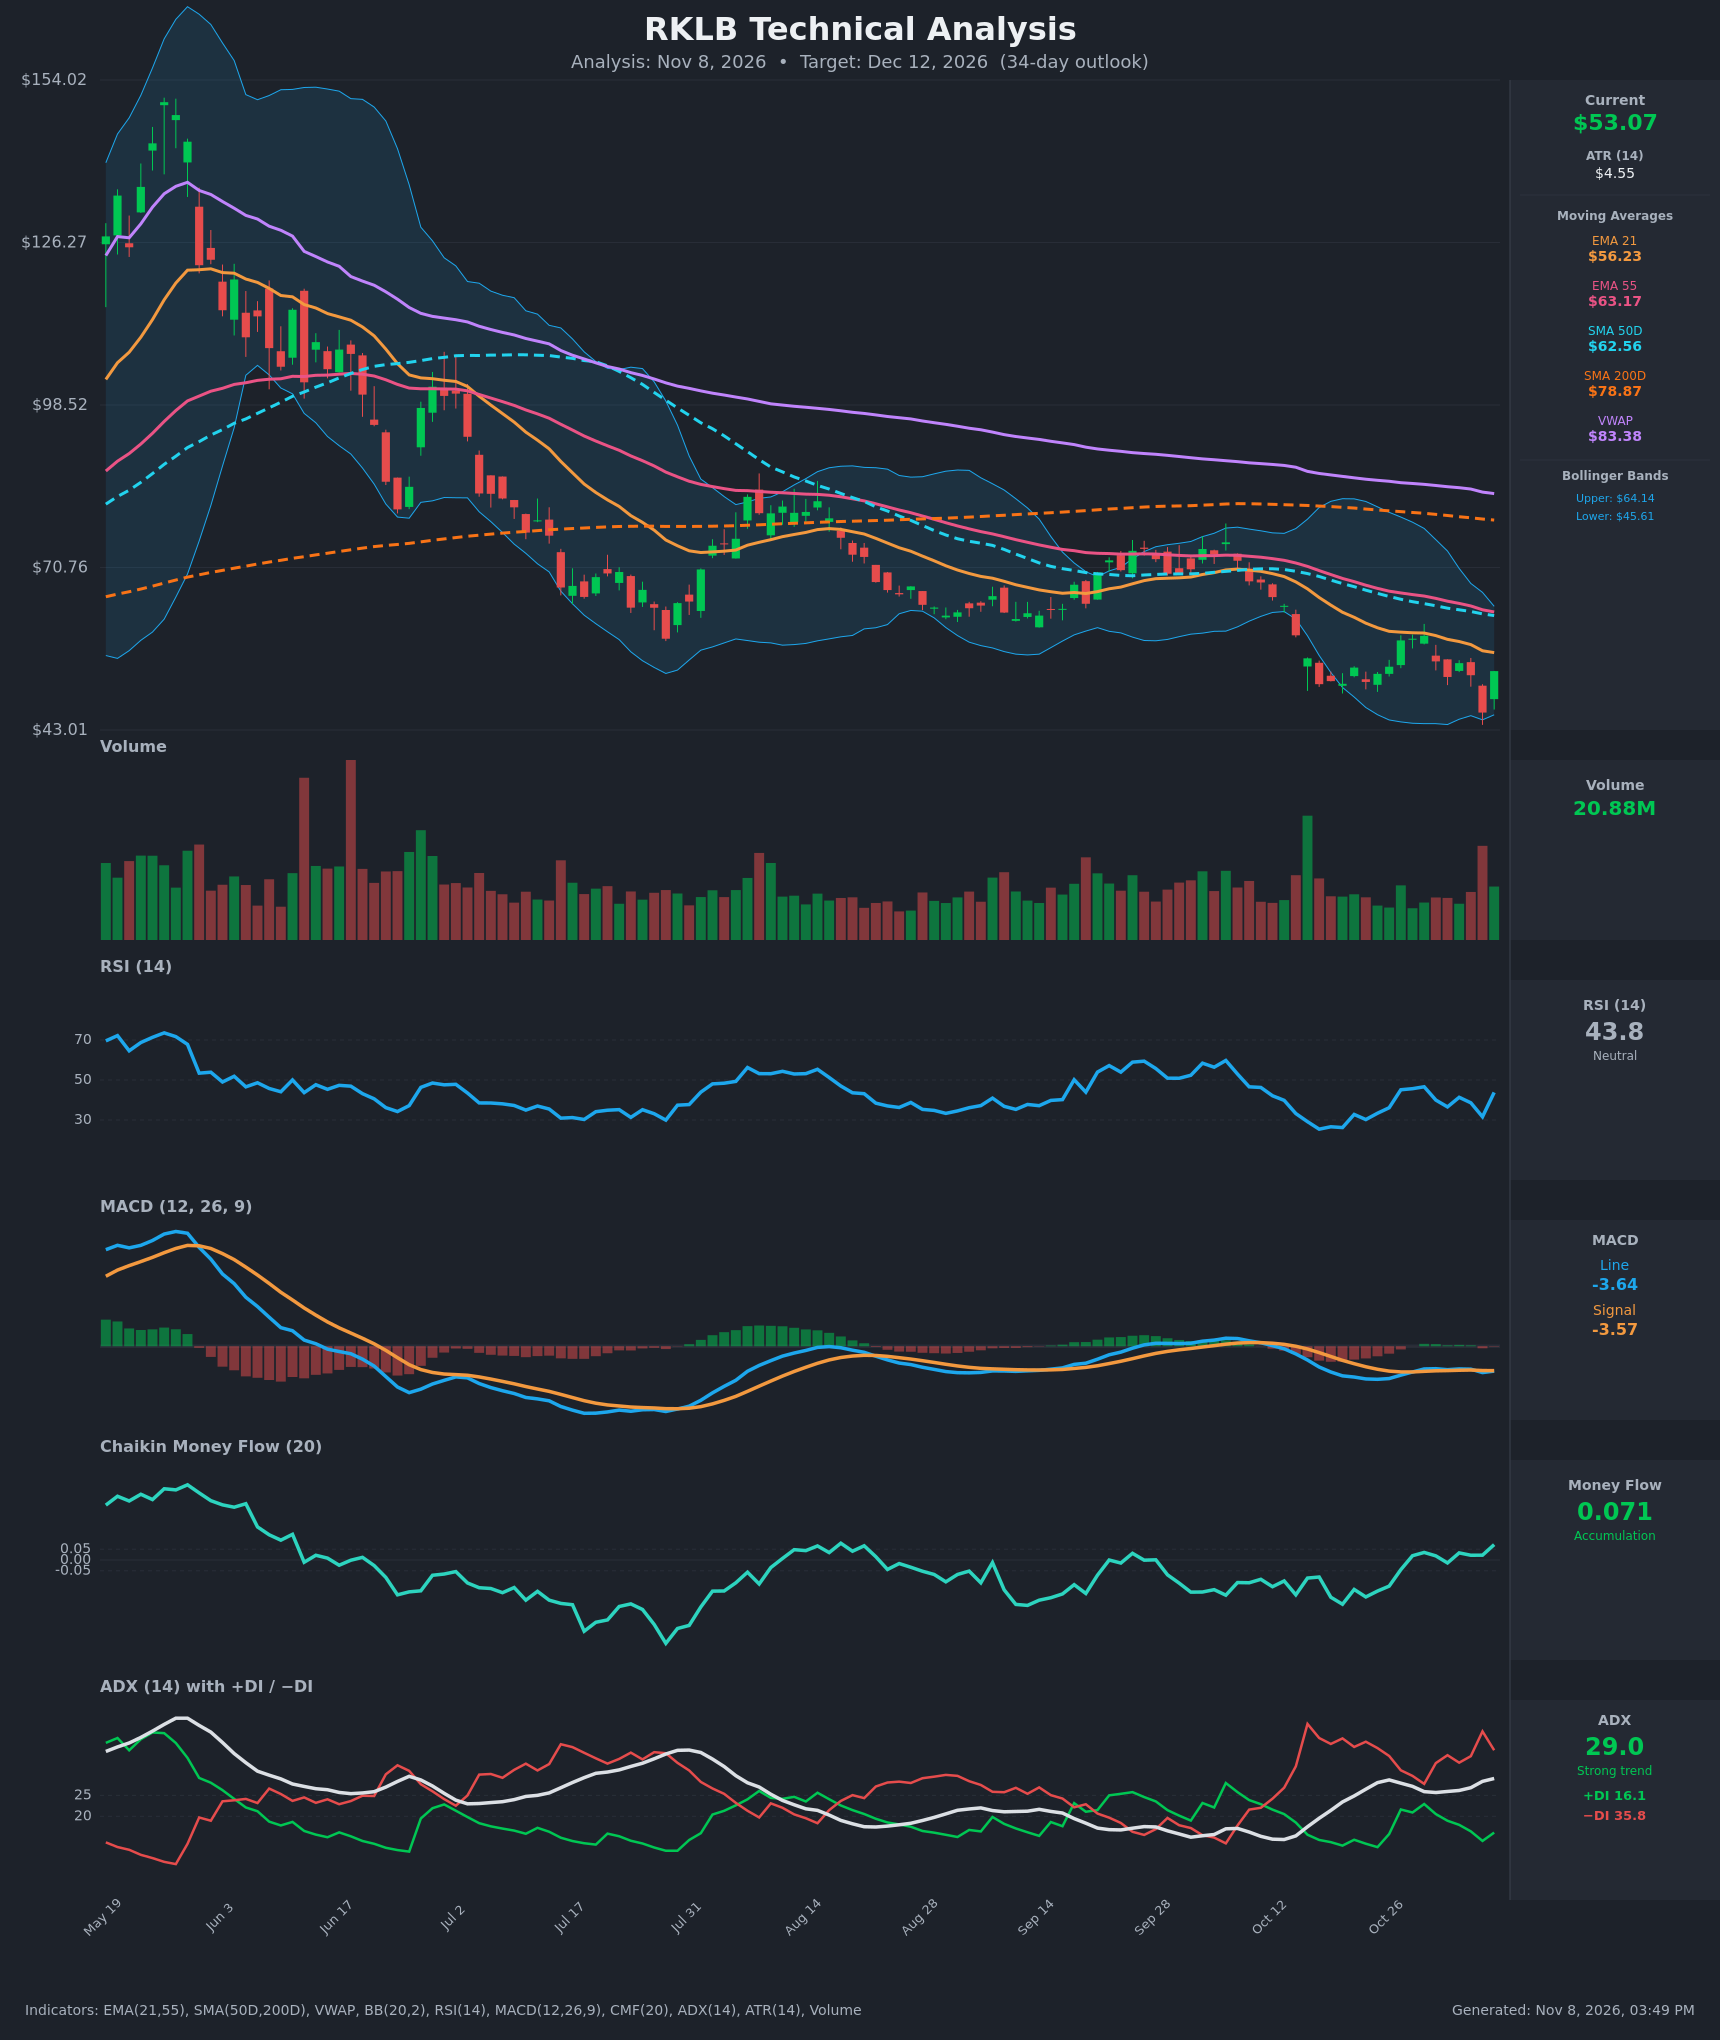
- RSI (14): 43.78. It bounced sharply from 31.6 yesterday and from 26 in late October, but it is still below 50 and has made lower highs (46.6 on Oct 29, 43.8 now). Momentum is a relief bounce inside a downtrend. [Neutral]
- 20 EMA: EMA 21 is $56.23 and price is $53.07, below it. EMA 21 is also well below EMA 55 ($63.17), and the EMA 21 line has fallen from $64.34 over 15 bars. It acts as overhead resistance. [Bearish]
- MACD: Line -3.640 is slightly below signal -3.575, so the histogram is marginally negative. Both lines sit deep below zero and are flat. There was a brief bullish cross on Oct 28 that failed, and the lines have been hugging each other since. Momentum is stalled but bearish. [Bearish]
- Bollinger Bands (20): Upper $64.14, lower $45.61, midline about $54.87. Price at $53.07 is just below the midline after a Nov 5 tag of the lower band ($45.99). The bands are fairly wide, and a close back inside from the lower band is a relief signal. Price is in the lower half of a downward-sloping channel. [Neutral]
- CMF (20): 0.071, above the +0.05 threshold and rising from -0.2 in October. Buying pressure is improving, and the recent bounce came with volume, though this is divergent against the price trend. [Accumulation]
- ADX (14): 29.0 and rising, with −DI (35.8) far above +DI (16.1). This is a strong downtrend, and bears remain in control even after the bounce. [Strong Trend – Bearish]
- Volume: 20.88M on the Nov 6 green candle, well above the recent average and among the higher prints in months. It is a high-volume reversal bar off the lows, but one bar is not confirmation. [Bullish short-term, needs follow-through]
DIVERGENCES & TRENDS
- Price vs CMF: Price made a lower low on Nov 5 ($45.99), well below the Oct 19-20 lows ($50.90-$51.36), while CMF has risen from -0.2 to +0.07. This is a bullish divergence suggesting accumulation.
- Price vs RSI: RSI's Nov 5 low of 31.6 was higher than the Oct 20 low of 26.2, a mild bullish divergence.
- Moving averages: Price is below the EMA 21, EMA 55, SMA 50D ($62.56), SMA 200D ($78.87) and VWAP ($83.38). The SMA 50D has already crossed below the SMA 200D (a death cross), and every average is sloping down. The long-term trend is firmly bearish.
- MACD: It is flat and just below its signal, with no bullish momentum shift yet. The Oct 28 cross failed.
- DI/ADX: −DI dominates and ADX is rising, so trend strength is increasing in the bearish direction.
- Price structure: The chart shows a series of lower highs and lower lows since the ~$150 peak in May. The bounce to $53.07 is a +15% single-day move off a spike low, and it ran into the lower-high structure beneath the EMA 21.
CHART PATTERNS
- Bearish Rising Wedge / Bearish Flag (continuation): The Oct 26-Nov 4 range ($52-$59) forms a small rally within a larger downtrend. It was rejected at the $59 area (Oct 29) and then broke down to $45.99, in line with the continuation target.
- Possible Bullish Double Bottom (reversal): The Oct 20 low (~$50.90) and the Nov 5 spike low ($45.99) are potential bottoms, but the lows are unequal and there is no confirmed neckline break. The neckline would be near $58-$59. This is only a possibility, not a signal.
- Overall: The dominant structure is a persistent downtrend with a bear-flag-style consolidation. The measured move from the Oct 19-Nov 4 range suggests support in the mid-$40s, which is roughly where the lower band sits.
- Key levels: Resistance is at $56.23 (EMA 21), $58-$59 (prior swing highs) and $62.5-$63 (SMA 50D / EMA 55). Support is at $50.90-$51 and $45.99.
POTENTIAL SCENARIOS
- Scenario 1: Bearish Trend Resumption — The Nov 6 bounce fades beneath the EMA 21, and the −DI-dominated downtrend continues with lower lows. The failed MACD cross and the stack of falling averages favor sellers. Trigger: rejection at $56-$58 or a close below $50.90. Target: $46-$48, with an extension to ~$43. Invalidation: daily close above $59 with MACD bullish crossover. (50% probability)
- Scenario 2: Bullish Relief Rally / Double-Bottom Attempt — The bounce off the $46 low, CMF accumulation and the high-volume reversal bar lead to a squeeze toward the Bollinger midline and prior highs. Trigger: close above $56.23 (EMA 21) and then $59. Target: $58-$63 (EMA 55 and SMA 50D). Invalidation: close below $50. (32% probability)
- Scenario 3: Neutral Choppy Base — Price ranges between $46 and $58 as the bear flag and CMF divergence offset each other. Trigger: failure to break either $46 or $59. Target: $50-$56. Invalidation: close outside the range. (18% probability)
PRICE TARGETS
34-day timeframe, with the range width set to ~15% of price (about $8.00; check: $8.00 / $53.07 ≈ 15%, within the 12-18% guideline for 30-60 days).
- Target Price: $50.50
- Expected Range: $45.50 to $58.50
- Key Levels: Support at $45.99, Resistance at $56.23
OVERALL BIAS
OVERALL BIAS: BEARISH - Price is below every moving average, the death cross is in place, ADX is rising at 29 with −DI far above +DI, and MACD is stalled below its signal line. The rising CMF and the high-volume bounce argue for a relief rally, but the bounce is likely to meet resistance near the EMA 21 and $58-$59.
This is educational analysis and not financial advice.