PLTR 34-day bearish forecast — Nov 8, 2026
- Bias: Bearish
- Timeframe: 34 days (made Nov 8, 2026, target date Dec 11, 2026)
- Price at analysis: $160.38
- Price target: $152.00
- Expected range: $140.00 – $168.00
- Result: Pending — graded after the close on Dec 11, 2026
Get a free AI analysis of PLTR today
Analysis
TECHNICAL INDICATORS
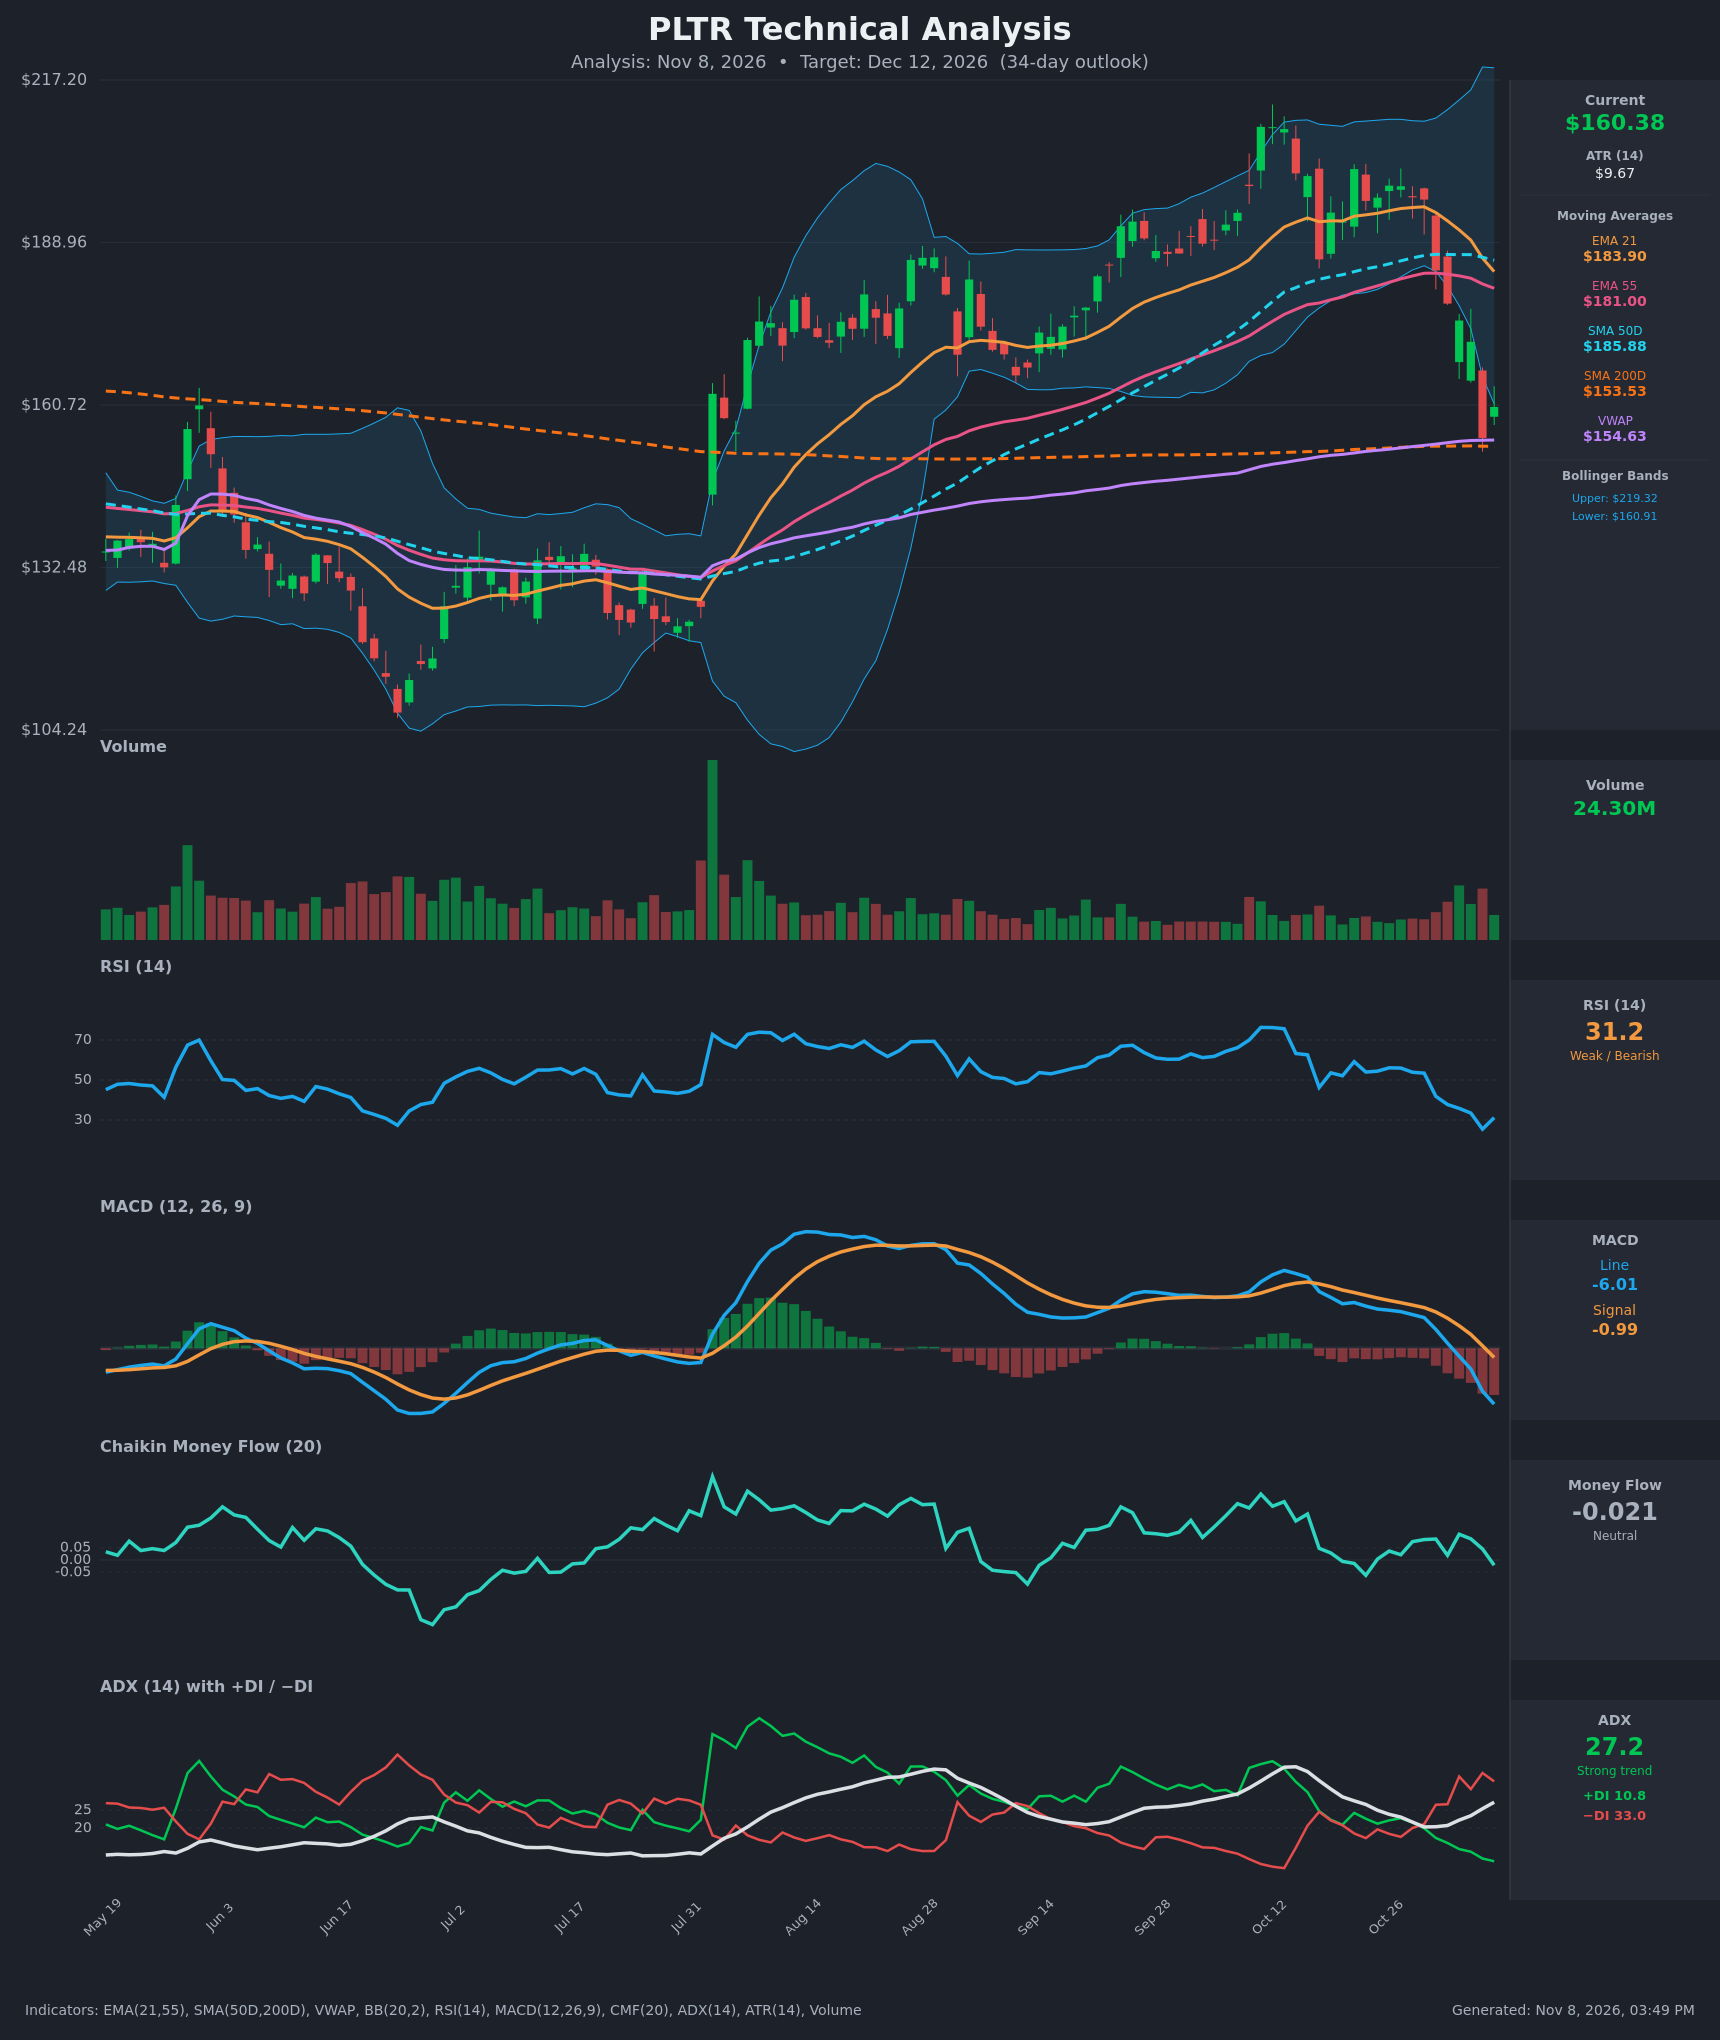
- RSI (14): 31.17, bouncing off 25.4 on Nov 5 after falling from 53 on Oct 29. It is near oversold, but still below 40 and has made no new momentum high. A bounce is possible, but the trend is down. [Bearish]
- 20 EMA: The chart uses EMA 21 at $183.90, with price at $160.38 about 12.8% below it. The EMA is sloping down sharply and is acting as overhead resistance. It is also converging on the EMA 55 ($181.00); the gap has narrowed from +$13.7 to +$2.9, so a bearish EMA 21/55 cross looks imminent. [Bearish]
- MACD: Line -6.01 is below signal -0.99, and both are below zero. The bearish cross happened around Nov 3, and the histogram is widening negative. That is accelerating downside momentum with no sign of flattening yet. [Bearish]
- Bollinger Bands (20): Upper $219.32, lower $160.91. Price is right at or just under the lower band after the bands stayed wide from the prior rally. This is an oversold stretch that can produce a snap-back, but in a strong trend price can keep walking the band. The midline (around $190) is far overhead. [Bearish]
- CMF (20): -0.021, inside the neutral zone. It has faded from +0.105 on Nov 3 and just crossed below zero. This is not heavy distribution yet, but buying pressure has vanished. [Neutral]
- ADX (14): 27.2 and rising from 20.3, with −DI 33.0 far above +DI 10.8. The bearish DI cross happened Oct 30 and the spread keeps widening. This is a strong, accelerating downtrend. [Strong Trend – Bearish]
- Volume: 24.30M. The Nov 5 breakdown candle came on elevated volume, while the Nov 6 bounce candle is small and light. Light-volume bounces after a high-volume breakdown tend to be weak relief rallies. [Bearish – selling on heavy volume, weak bounce]
Other moving averages:
- Price is below SMA50D ($185.88) and EMA 55.
- Price is above SMA200D ($153.53) and VWAP ($154.63). These are the nearest support cluster.
- No death cross yet: SMA50D is still far above SMA200D. The long-term structure is intact, but the short and medium term have broken.
DIVERGENCES & TRENDS
- There is no bullish RSI or MACD divergence. Both made lower lows alongside price, so momentum confirms the decline.
- RSI has turned up from 25.4, but the MACD histogram is still deepening. Momentum has not stabilized.
- The recent trend is a sharp break from about $196 (Oct 29) to $155 (Nov 5), roughly 21% in 5 sessions. That included a roughly 10% single-day drop on Nov 5.
- Crossovers and breaks:
- MACD crossed below its signal and below zero (Nov 3).
- −DI crossed above +DI (Oct 30), and ADX has been rising since.
- Price broke below the EMA 21, EMA 55 and SMA50D, and below the Aug–Oct consolidation floor of about $165–170.
- The EMA 21/55 bearish cross is approaching.
- CMF faded from positive to slightly negative, which is a mild confirmation of the weakness.
CHART PATTERNS
- The Aug–Oct action fits a Bearish Triple Top / Rectangle-style reversal, with highs near $200–210 and a floor in the mid-$160s. The Nov 5 close at $154.99 broke that floor decisively. The full measured move (range height of about $35–40 projected down from $165) points to the $125–130 area. That is a long way down and would require losing SMA200D.
- The current bounce to $160 looks like a Bearish Flag/Pennant forming at the SMA200D. If the bounce stalls near $168–175 (the broken support area and the Nov 3–4 closes at $171.70–175.40), the pattern would resolve lower.
- Counterpoint: SMA200D ($153.53), VWAP ($154.63) and the Nov 5 low form a confluence support zone. RSI at the 25–31 level has historically produced relief bounces on this chart (the June low, for example).
POTENTIAL SCENARIOS
- Scenario 1: Bearish Bear-Flag Resolution and Test of SMA200D — A weak relief bounce stalls under the former support and the falling EMAs, then rolls over as the EMA 21/55 bearish cross confirms. Price retests and possibly slices through the $153–155 support cluster. Trigger: failure at $168–172 and a daily close below $153.50. Target: $140–$152. Invalidation: daily close above $176 (reclaiming the Nov 3 level). (50% probability)
- Scenario 2: Bullish Oversold Relief Rally — The SMA200D/VWAP confluence holds, RSI mean-reverts toward 45–50, and price rallies back to the broken support and the EMA 55 area. Trigger: hold above $154.60 with a close above $166 on rising volume. Target: $172–$180. Invalidation: close below $153.50. (35% probability)
- Scenario 3: Neutral Base-Building Chop — Price oscillates between SMA200D support and $168 resistance while momentum indicators reset. Trigger: ADX rolls over and price closes between $154 and $168 for several sessions. Target: $155–$168 range. Invalidation: a decisive close outside that range. (15% probability)
PRICE TARGETS
For a 34-day horizon, the range width should be about 12–18% of price. The range below is $28 wide, about 17.5% of $160.38.
- Target Price: $152.00
- Expected Range: $140.00 to $168.00
- Key Levels: Support at $153.53 (SMA200D, with VWAP just above at $154.63), Resistance at $171.70
OVERALL BIAS
OVERALL BIAS: BEARISH - ADX at 27 and rising with −DI far above +DI, a deepening bearish MACD, price below all short- and medium-term moving averages, and a high-volume breakdown from the Aug–Oct range outweigh the oversold RSI. I expect price to drift lower toward or just through the SMA200D support, though a relief bounce along the way is likely.
This is educational analysis and not financial advice.