NVDA 34-day bearish forecast — Nov 8, 2026
- Bias: Bearish
- Timeframe: 34 days (made Nov 8, 2026, target date Dec 11, 2026)
- Price at analysis: $186.64
- Price target: $179.00
- Expected range: $166.00 – $198.00
- Result: Pending — graded after the close on Dec 11, 2026
Get a free AI analysis of NVDA today
Analysis
TECHNICAL INDICATORS
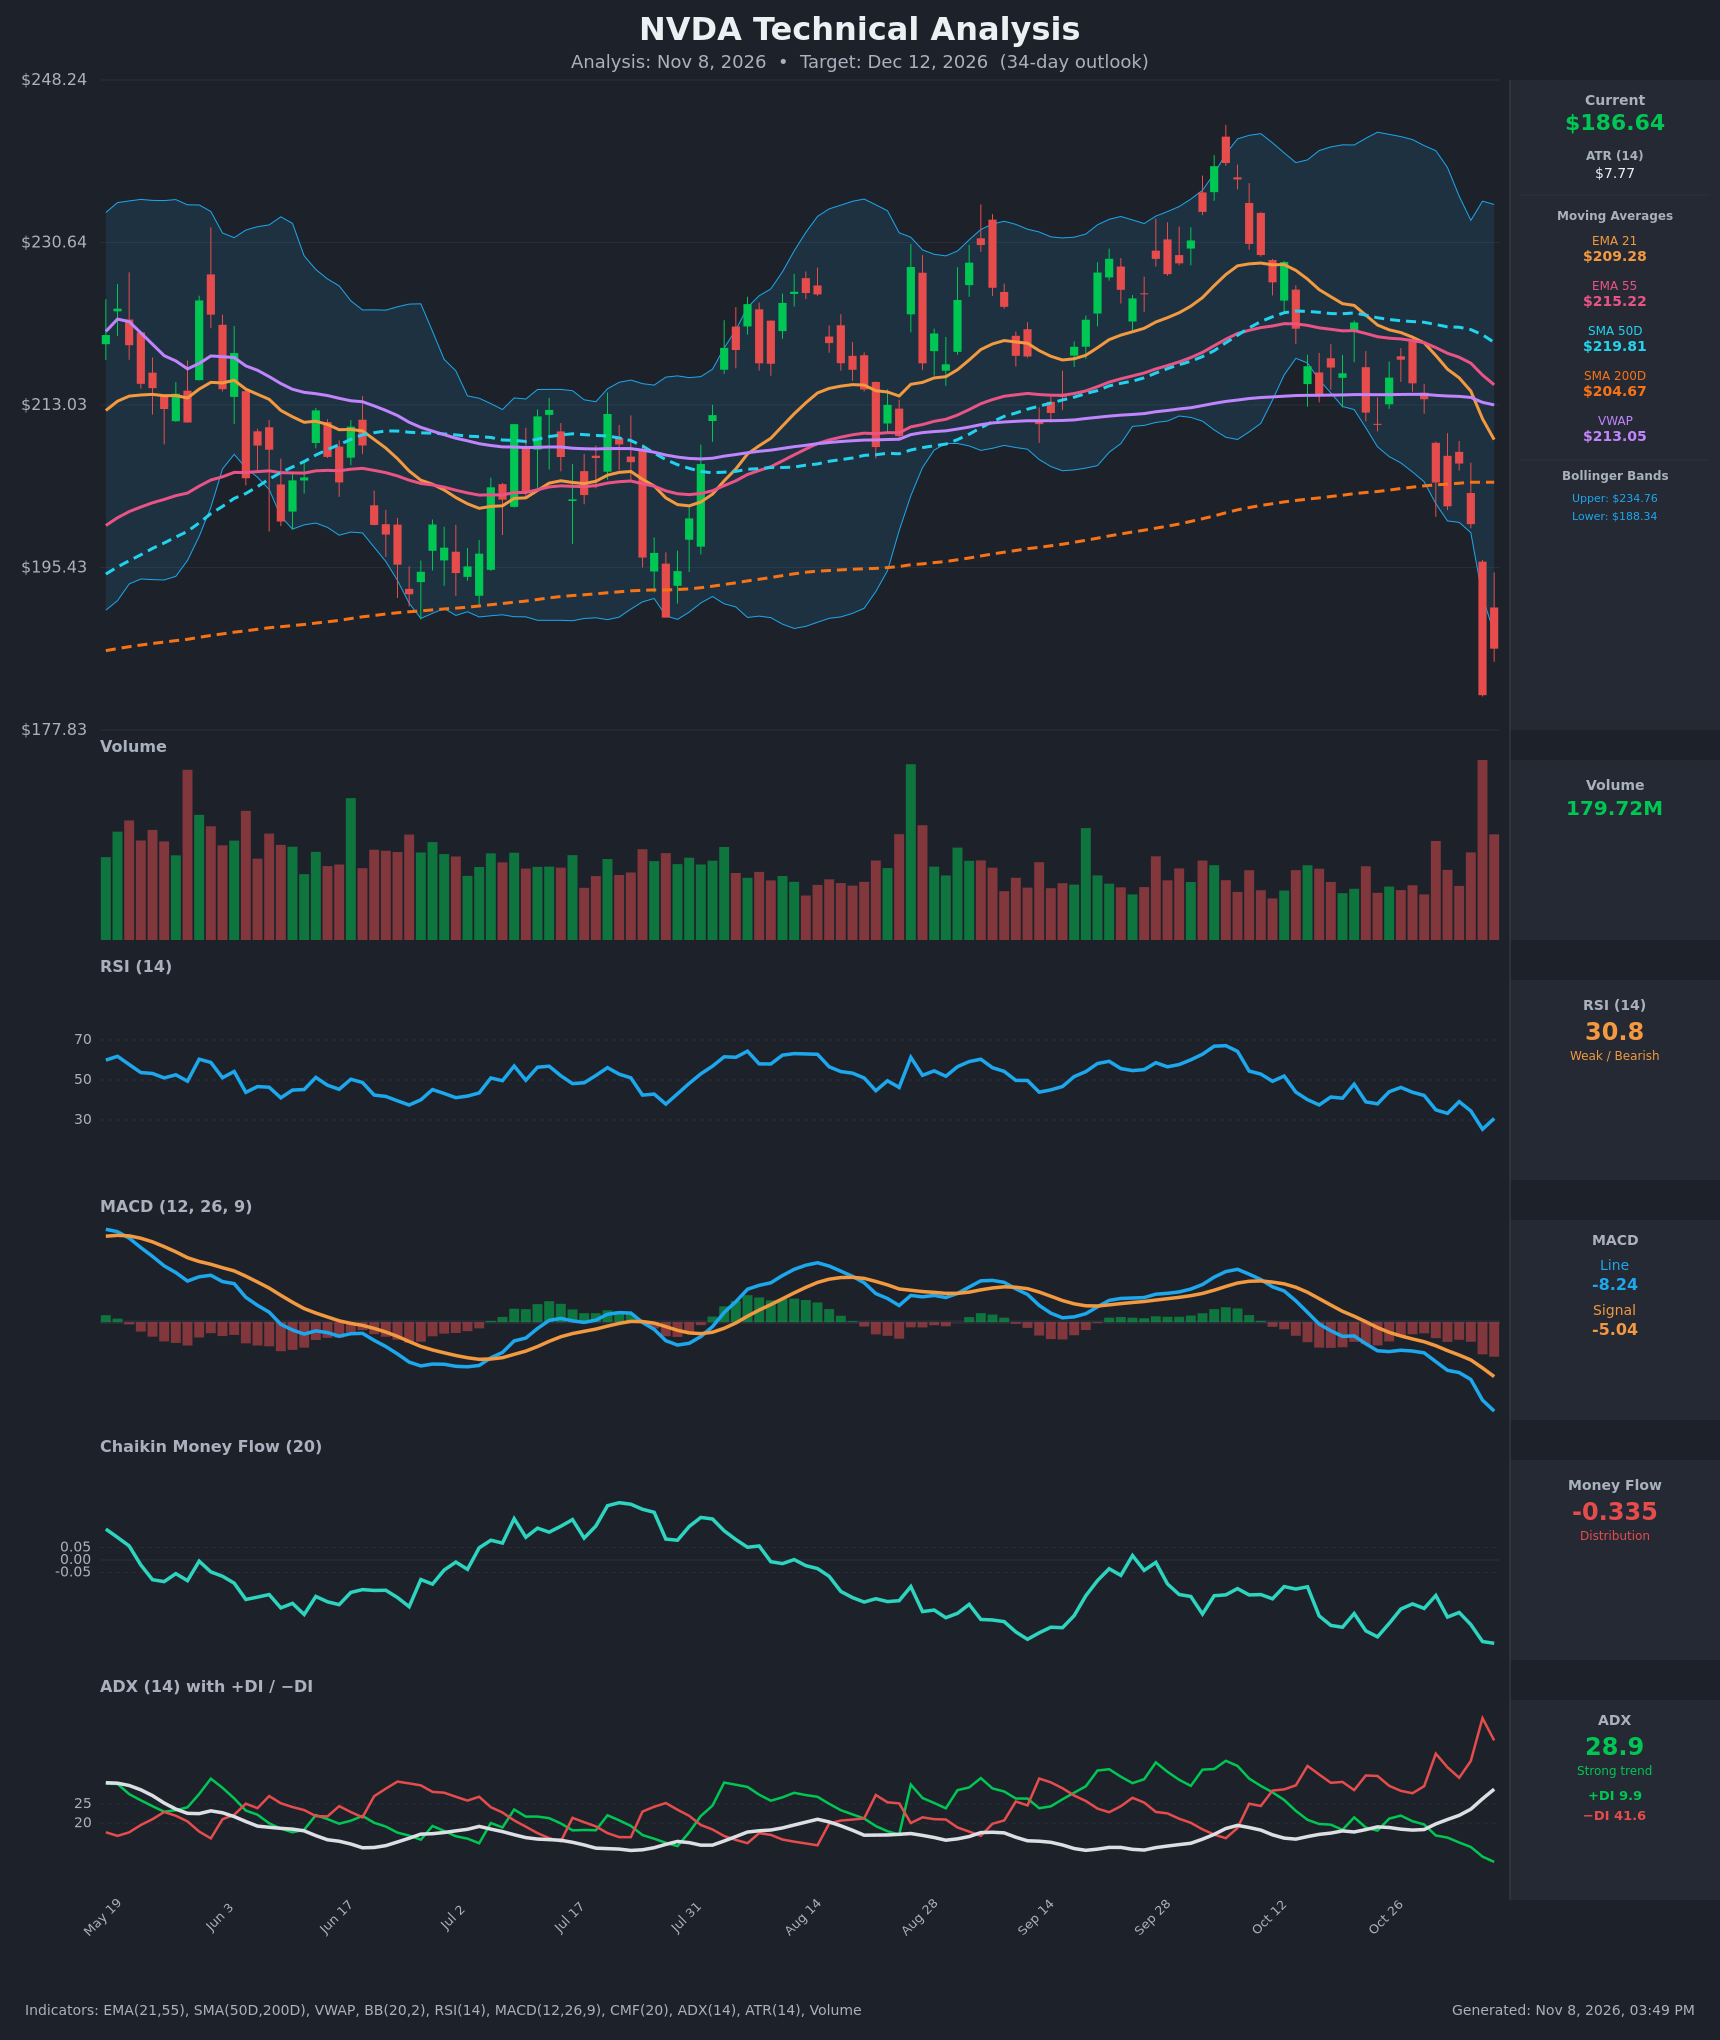
- RSI (14): 30.76, just bouncing off 25.4 on Nov 5, the most oversold reading in the whole window. It is still under 40 and well below the 50 midline, so momentum is bearish. The small uptick from 25.4 is not a divergence, because the low was set on the same capitulation bar as the price low. [Bearish]
- 20 EMA: The data gives the EMA 21 at $209.28, and price at $186.64 is about 10.8% below it. The EMA is falling steeply (224.76 to 209.28 in 15 bars) and acts as overhead resistance. EMA21 crossed below EMA55 ($215.22) around Oct 29-30, which is a bearish crossover. [Bearish]
- MACD: Line -8.24 is below Signal -5.04, with a histogram of about -3.2 that has widened every bar. The bearish crossover happened around Oct 22-23 and the gap is still expanding. The MACD is at its lowest level on the chart. [Bearish]
- Bollinger Bands (20): Price is $186.64 against a lower band of $188.34, so it closed below the band after a band-walk on Nov 5. The bands have expanded (upper $234.76, lower $188.34), which signals a volatility expansion to the downside. This is stretched and favors a relief bounce, but a band-walk in a strong trend is not a reversal signal on its own. [Bearish]
- CMF (20): -0.335 is deep distribution, far below -0.05, and is at a new low for the period. It has been negative for the entire 15-bar window with no sign of recovery. [Distribution]
- ADX (14): 28.9 and rising (17.4 to 28.9), above the 25 trend threshold. −DI at 41.6 is far above +DI at 9.9, and +DI is at its lowest on the chart. This is a strong, one-sided downtrend. [Strong Trend – Bearish]
- Volume: 179.72M, with the Nov 5 volume bar the largest on the chart, so selling pressure is heavy. The heaviest volume came on the breakdown candle, which confirms distribution. It could also mark a capitulation, but no follow-through buying has shown up yet. [Bearish – high-volume breakdown]
Other context:
- SMA 200D: Price is below the SMA 200D ($204.67), so the long-term trend has turned negative.
- SMA 50D: The SMA 50D ($219.81) is rolling over. A death cross has not occurred, but the 50D/200D gap has narrowed to about $15.
- VWAP: Price is below VWAP ($213.05), which means sellers are in control.
DIVERGENCES & TRENDS
- No bullish divergence. RSI and MACD made new lows with price, and CMF and −DI also hit extremes on the breakdown.
- MACD momentum is accelerating downward, with the histogram widening each day. The MACD line has not turned up.
- The EMA stack is bearish: price < EMA21 < EMA55 < SMA50D. Price has also fallen through the SMA200D at $204.67, which broke on Nov 2.
- ADX is rising with −DI dominant, so the trend is strengthening rather than exhausting.
- Price is stretched about 10% below EMA21 and below the lower Bollinger Band, so a relief rally toward $195-$205 is likely at some point, but those are resistance zones in a downtrend.
CHART PATTERNS
- Bearish Double Top (loose): The Aug-Sep highs near $230-$235 and the Oct peak near $242 form a broad double top. Price has broken below the $205-$208 area (SMA200D / prior consolidation lows). The measured move is roughly $242 minus about $207 = $35, which points to about $172.
- Bearish Flag / Pennant potential: A weak bounce into $195-$205 followed by a lower high would form a bearish flag after the sharp drop, continuing toward the $172-$178 area.
- Caveat: The Nov 5 volume spike with a long lower wick could mark a capitulation low. A close back above $200 on strong volume would negate the bearish patterns.
POTENTIAL SCENARIOS
- Scenario 1: Bearish Trend Continuation — Sellers keep control after a weak bounce (bear-flag behavior). The relief rally fails below the $195-$205 resistance zone (broken SMA200D and the Nov 4 close), and price makes new lows. Trigger: A rejection at $195-$200 or a close below $178. Target: $172-$178 (measured move), with an extension toward $168. Invalidation: A daily close above $205 (SMA200D). (45% probability)
- Scenario 2: Bullish Capitulation Reversal / Relief Rally — The Nov 5 volume spike was the washout. Oversold RSI and the stretch below the Bollinger Band trigger a mean-reversion bounce toward the falling EMA21. Trigger: A close above $195.50 with CMF turning up. Target: $203-$210 (SMA200D, then EMA21 at $209). Invalidation: A close below $178. (35% probability)
- Scenario 3: Neutral Basing Range — Price chops between $178 and $198 as the selling is absorbed, and indicators slowly reset. Trigger: Alternating small candles with falling volume and a flattening MACD histogram. Target: $180-$192. Invalidation: A break outside the $178-$198 range on volume. (20% probability)
PRICE TARGETS
- Target Price: $179.00 (34-day timeframe)
- Expected Range: $166.00 to $198.00 (width $32 = about 17% of current price, which fits the 30-60 day guidance of 12-18%)
- Key Levels: Support at $178.00 (Nov 5 low area), Resistance at $195.50 (prior July lows and the zone above the lower Bollinger Band)
OVERALL BIAS
OVERALL BIAS: BEARISH - Every trend and flow gauge is bearish: price is below the EMAs, VWAP and SMA200D, MACD is widening below signal, ADX is 28.9 with −DI at 41.6 against +DI at 9.9, CMF is -0.335, and the breakdown came on heavy volume. The oversold RSI and the break below the lower Bollinger Band make a relief bounce likely, but the weight of evidence favors the downtrend continuing, with a modest target about 4% lower.
This is educational analysis and not financial advice.