SMH 34-day bearish forecast — Nov 8, 2026
- Bias: Bearish
- Timeframe: 34 days (made Nov 8, 2026, target date Dec 11, 2026)
- Price at analysis: $463.96
- Price target: $450.00
- Expected range: $418.00 – $488.00
- Result: Pending — graded after the close on Dec 11, 2026
Get a free AI analysis of SMH today
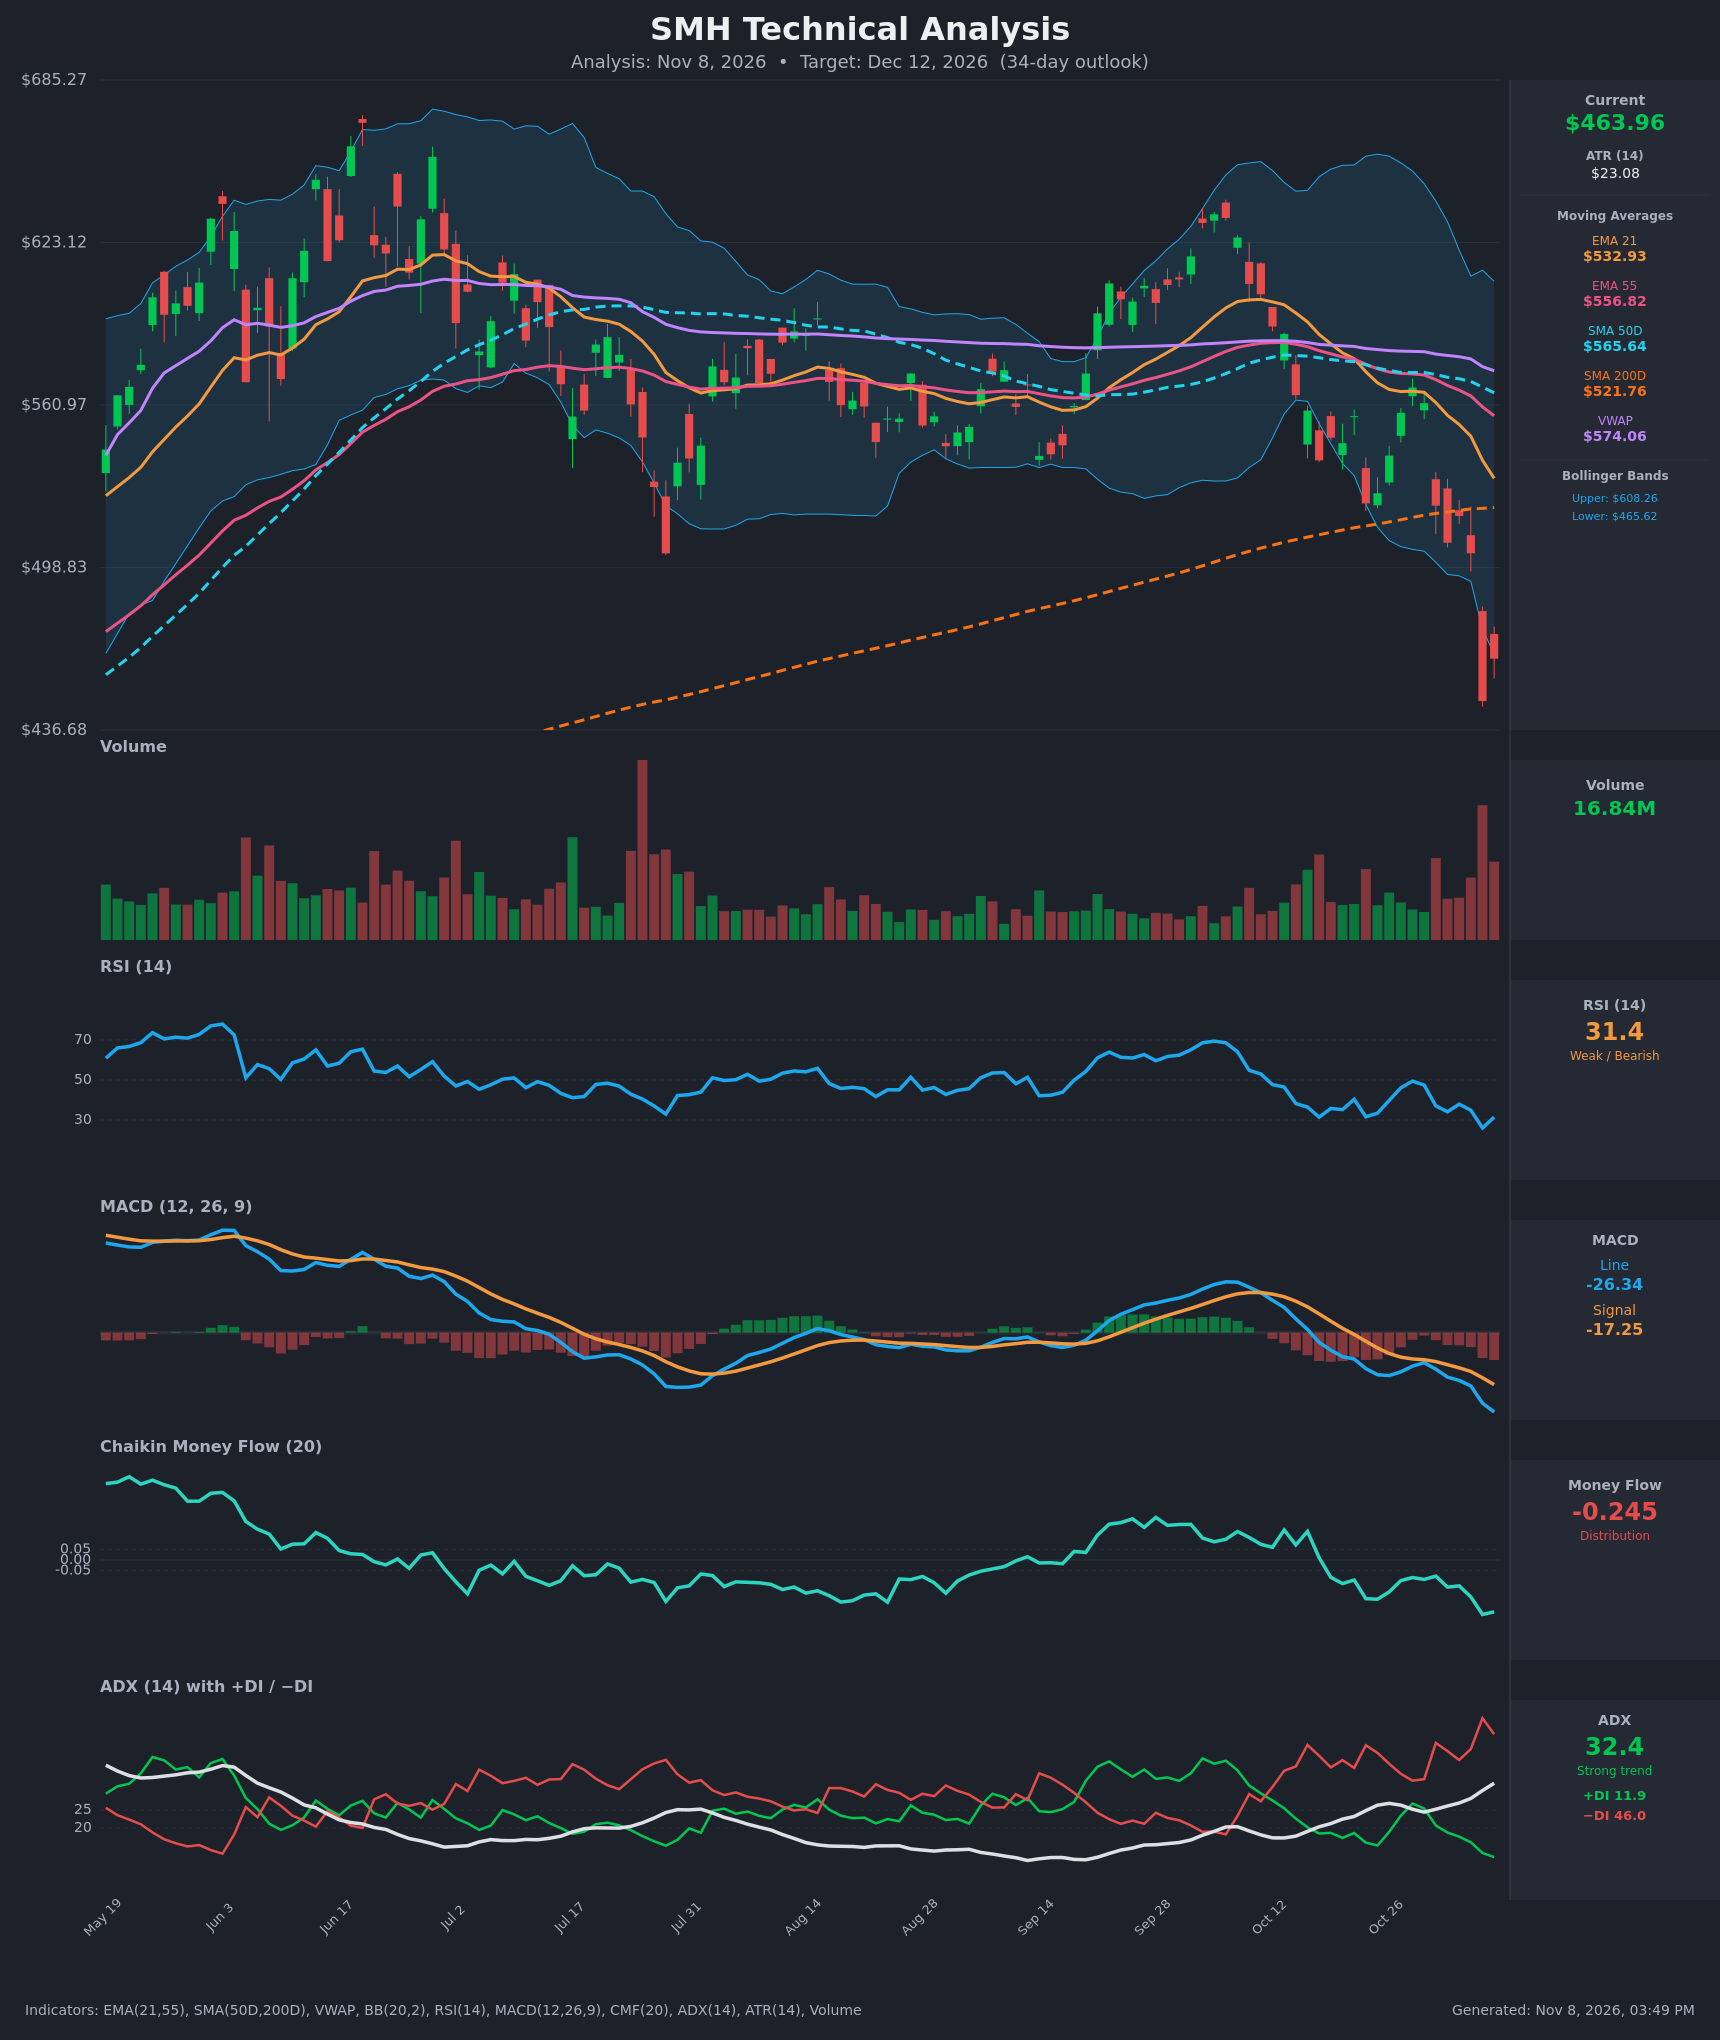
Analysis
TECHNICAL INDICATORS
- RSI (14): 31.41, just back above the 30 line after a Nov 5 low of 26.0. Momentum is weak and still pointing down, with lower RSI lows through October. Oversold, but there is no bullish divergence yet. [Bearish]
- 20 EMA (EMA 21 = $532.93): Price at $463.96 is about 13% below the EMA, which has been falling steadily from $584 on Oct 19. It is dynamic resistance, and EMA21 is also below EMA55 ($556.82), a bearish alignment. [Bearish]
- MACD: Line -26.34 is below signal -17.25, with the gap widening (histogram about -9). The line made a new low and crossed below the signal around Oct 29–30. Bearish momentum is accelerating. [Bearish]
- Bollinger Bands (20): Price is at the lower band ($465.62), with the Nov 5 candle piercing well below it. The upper band is $608.26, so the bands are wide and expanding. Walking the lower band in a strong trend is bearish, though a snap-back toward the mid-band is possible. [Bearish]
- CMF (20): -0.245, deep in distribution and at its lowest reading on the chart. It has fallen from about -0.08 two weeks ago, so selling pressure is persistent. [Distribution]
- ADX (14): 32.4 and rising, above the 25 threshold, with −DI at 46.0 far above +DI at 11.9. The −DI/+DI gap is very wide. This is a strong, established downtrend. [Strong Trend – Bearish]
- Volume: 16.84M, with the Nov 5 breakdown candle showing the largest volume bar of the recent period. The heavy volume on the decline confirms the selling and could also hint at a partial capitulation. Follow-through volume on the bounce has been lower. [Bearish confirmation, with some capitulation risk]
DIVERGENCES & TRENDS
- Divergences: There is no bullish divergence. RSI, MACD and CMF all made new lows alongside price, so momentum confirms the decline.
- Trend: Price is below every key average: EMA21 ($532.93), EMA55 ($556.82), SMA50D ($565.64), VWAP ($574.06) and now SMA200D ($521.76). The Nov 5 close at $447.73 was a decisive break of the 200-day, the long-term trend line. The 200-day itself is still rising, so there is no death cross, but SMA50D is rolling over.
- Crossovers and breaks:
- EMA21 crossed below EMA55 in late October.
- MACD crossed below signal around Oct 29–30 and has since widened.
- −DI has been above +DI since Oct 30.
- Price lost the Aug–Oct range floor of roughly $505–$520.
- Offsetting factor: Price is roughly 2 ATRs (about 9 ATR from the EMA21 in total) stretched below its short-term averages, so a relief bounce is likely at some point. Such bounces in a strong ADX downtrend tend to stall under the broken support.
CHART PATTERNS
- Bearish Double Top (reversal): Peaks near $670 in June and about $630 in early October, with a neckline around $505. That neckline gave way on Nov 5, which confirms the pattern. The full measured move (about $165) would imply the $340s. This is an extreme level and unlikely within 34 days, but it shows the downside risk is larger than the upside.
- Bearish Flag / Pennant (continuation): The Oct 26–29 bounce, up to the $567 area, was a weak counter-trend rally that failed under EMA21/EMA55, then broke down. A flag target would extend toward the mid-$400s or lower.
- Resistance: The $505–$522 zone (old neckline plus the SMA200D) should now act as overhead supply on any bounce.
POTENTIAL SCENARIOS
- Scenario 1: Bearish Trend Continuation — Price fails to reclaim the broken 200-day and neckline and grinds lower, with a possible lower-high bounce into $495–$505. Trigger: rejection at $505–$522 or a close below $437. Target: $440–$450 first, with an extension toward $420. Invalidation: daily close above $522 (SMA200D). (45% probability)
- Scenario 2: Bullish Oversold Relief Bounce — The Nov 5 capitulation volume marks a short-term low, and price mean-reverts toward the EMA21. Trigger: RSI turning up from 30 with a bullish MACD histogram turn and a close above $490. Target: $500–$533 (the EMA21 area). Invalidation: a close below $437. (40% probability)
- Scenario 3: Neutral Base-Building — Price chops sideways between $437 and $505 as selling exhausts. Trigger: low-volume basing with ADX fading. Target: about $455–$475. Invalidation: a break outside the $437–$505 band. (15% probability)
PRICE TARGETS
- Target Price: $450.00 (34-day horizon)
- Expected Range: $418.00 to $488.00 (width $70, about 15.1% of current price, in line with the 12–18% guidance for 30–60 days)
- Key Levels: Support at $437.00, Resistance at $505.00
OVERALL BIAS
OVERALL BIAS: BEARISH - A confirmed breakdown below the SMA200D and the double-top neckline, a strongly trending ADX of 32.4 with −DI dominant, a widening MACD gap and deep CMF distribution all favor further downside. The oversold RSI and lower-band reading make a relief bounce likely, but overhead resistance at $505–$522 should cap it.
This is educational analysis and not financial advice.