SOFI 34-day bearish forecast — Nov 8, 2026
- Bias: Bearish
- Timeframe: 34 days (made Nov 8, 2026, target date Dec 11, 2026)
- Price at analysis: $16.21
- Price target: $15.60
- Expected range: $14.60 – $17.05
- Result: Pending — graded after the close on Dec 11, 2026
Get a free AI analysis of SOFI today
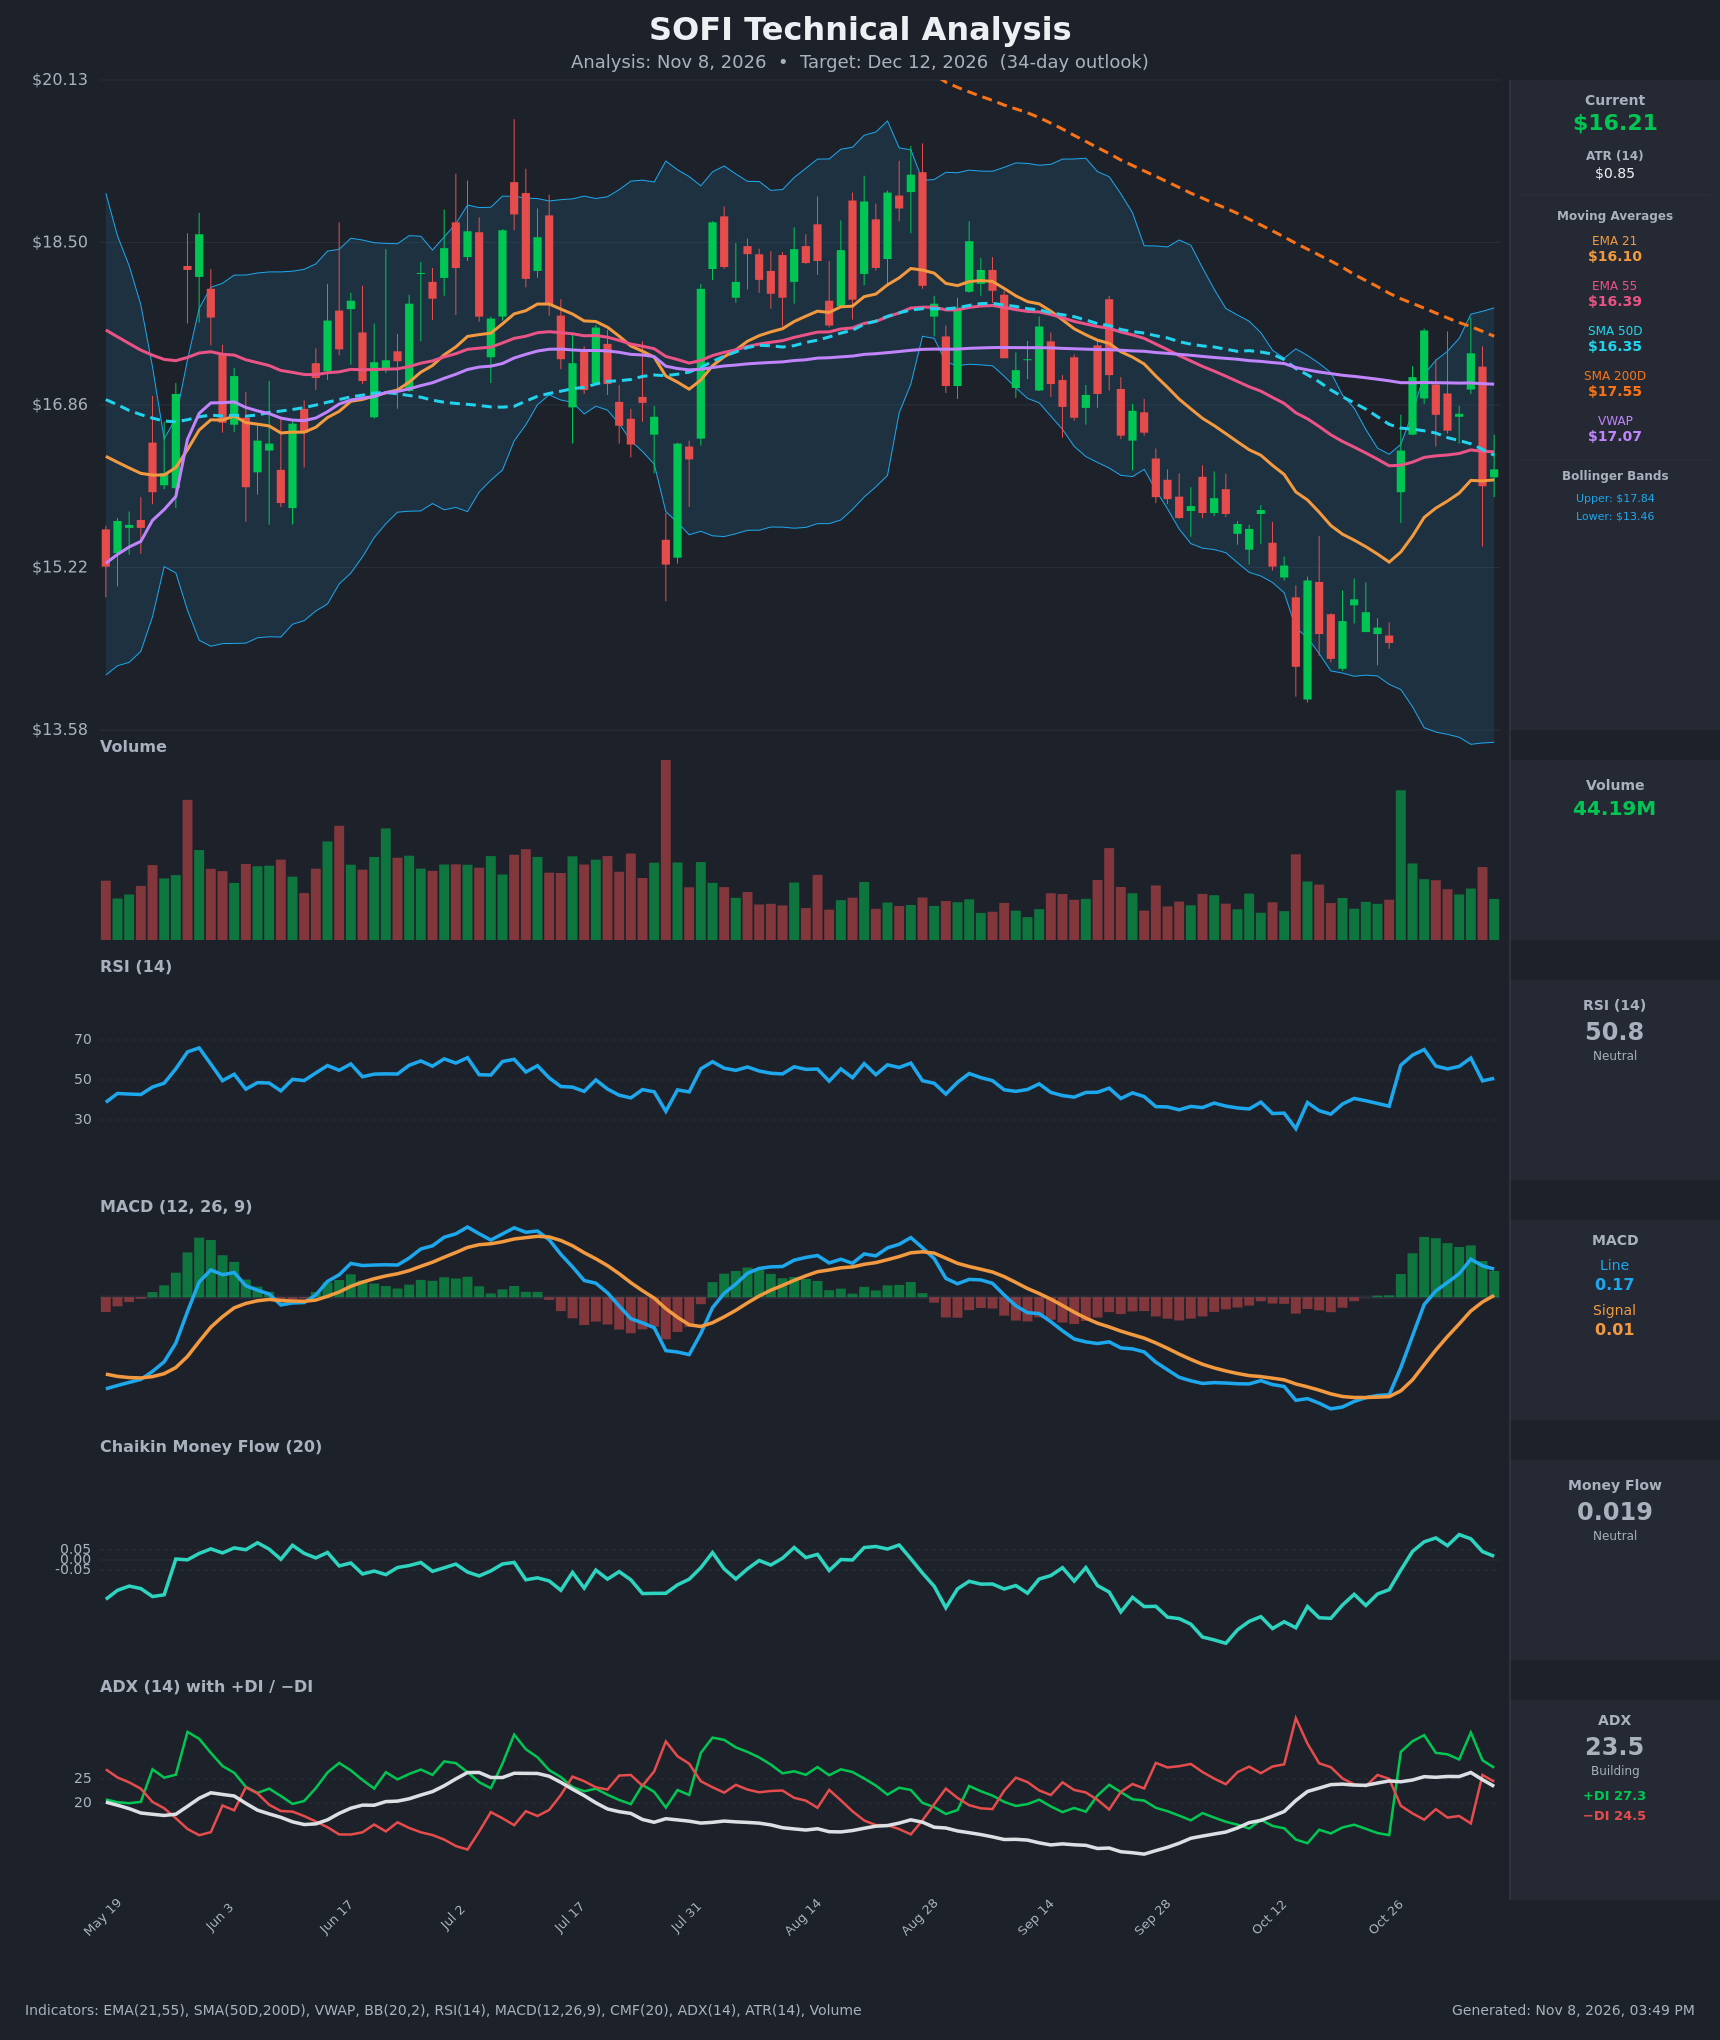
Analysis
TECHNICAL INDICATORS
- RSI (14): 50.83, dead neutral. It fell from 65.2 (Oct 29) to 49.6 on Nov 5 and has stabilized near 50, so the bounce momentum has faded without turning oversold. [Neutral]
- 20 EMA (EMA 21): $16.10. Price at $16.21 is only marginally above it, so it is acting as thin support. EMA21 is still below EMA55 ($16.39), so there is no bullish EMA cross, and the Nov 5 close of $16.04 briefly lost it. [Neutral]
- MACD: Line 0.172 is above signal 0.011, a bullish cross that occurred around Oct 30. The histogram (about +0.16) peaked near Nov 4 and is now contracting, so upside momentum is fading as the line rolls over from 0.232. [Neutral]
- Bollinger Bands (20): Upper $17.84, lower $13.46, midline about $15.65. Price sits in the upper-middle part of a wide band. The band width reflects the Oct 27–29 spike. The rally stalled below the upper band at $17.61 and has pulled back toward the mid-zone. [Neutral]
- CMF (20): 0.019, inside the ±0.05 neutral zone and down from 0.126 on Nov 3. Buying pressure has drained back toward zero after the rally. [Neutral]
- ADX (14): 23.5 and falling from 26.3, with +DI 27.3 above −DI 24.5. Bulls are nominally on top, but the DI spread has narrowed sharply from 18.8 points (Nov 4) to 2.8 points after the Nov 5 reversal. The trend is weakening and the setup is transitional. [Weak Trend, slight bullish DI edge]
- Volume: 44.19M, in line with recent averages. The largest volume was on the Oct 27 breakout bar, which showed real demand. The Nov 5 red candle (−7.7%) came on elevated volume, which points to supply near $17.4–17.6. [Mixed / Slightly Bearish]
- Long-term MAs and VWAP: Price is below SMA50D ($16.35), SMA200D ($17.55) and VWAP ($17.07). SMA50D is below SMA200D (death cross in effect). SMA200D is still sloping down. [Bearish]
DIVERGENCES & TRENDS
- There is no clear price/indicator divergence. The Oct 29 high ($17.61) came with RSI at 65, and the later pullback has RSI back at 50, so momentum has confirmed the price retracement.
- The MACD histogram is declining while the MACD line has rolled over from 0.232 to 0.172. This is early bearish momentum deceleration, not yet a cross.
- ADX has dropped from 26.3 to 23.5, with −DI spiking from 15.8 to 25.8 on Nov 5. That signals the bounce lost control to sellers for a day.
- Price has formed a higher low. The late-October low was about $13.9, a V-shaped recovery of roughly 26% up to $17.61. The rejection came just under SMA200 ($17.55 and still falling), which acts as dynamic resistance.
- The broader trend since August (from about $19 to $14) is still down. Price has been unable to reclaim EMA55, SMA50D, SMA200D or VWAP on a closing basis.
- Price now sits in a tight cluster of $16.04–16.39 (EMA21, SMA50D, EMA55). It will likely break out of this cluster soon.
CHART PATTERNS
- Bearish Rising Wedge / Bearish Flag-like retracement: The sharp V-bounce followed by a lower-high rejection resembles a relief rally within a larger downtrend. A failure to hold $16.0 would target the $14.5–15.0 area. The measured move is about the height of the $14.3–17.6 swing, but I treat the $14.5–15.0 zone as the more realistic target.
- Possible Bullish Double Bottom (lows near $13.9 and a retest above): This is only a partial match. It would need a close above the $17.6 neckline, which is also the SMA200 and the Oct 29 high. Until that happens it is unconfirmed, with a target above $19.
- Overall structure: A wide $14–17.6 trading range inside a longer-term downtrend. The longer-term trend and the rejection at resistance give the edge to the bearish read.
POTENTIAL SCENARIOS
- Scenario 1: Bearish Rejection Fails the Bounce — The relief rally is capped under SMA200 and VWAP, and the declining MACD histogram leads to a bearish MACD cross. Price loses the EMA21/SMA50D cluster and drifts toward the mid-Bollinger zone. Trigger: daily close below $15.90 (below the Nov 5 low of about $16.04) with MACD histogram turning negative. Target: $15.00–15.60, with an extension to $14.50. Invalidation: daily close above $17.10 (VWAP). (50% probability)
- Scenario 2: Bullish Breakout Through the MA Cluster — Buyers defend the EMA21, the +DI lead is maintained, and price reclaims EMA55/SMA50D. This extends the V-recovery toward the SMA200 and the Oct 29 high. Trigger: close above $16.60 on rising volume, with ADX turning back above 25. Target: $17.50–17.85, with a stretch to $18.50 on a close above $17.8. Invalidation: close below $15.80. (35% probability)
- Scenario 3: Neutral Chop in the Cluster — Price oscillates between $15.50 and $17.00 as ADX falls below 20. Trigger: ADX under 20 and repeated closes within $15.8–16.8. Target: $16.00–16.50. Invalidation: close outside $15.30–17.30. (15% probability)
PRICE TARGETS
For the 34-day timeframe (Dec 12, 2026):
- Target Price: $15.60
- Expected Range: $14.60 to $17.05 (width $2.45, about 15.1% of the current price, consistent with the 12–18% guide for 30–60 days)
- Key Levels: Support at $14.50, Resistance at $17.07
OVERALL BIAS
OVERALL BIAS: BEARISH - Price remains below the SMA50D, SMA200D, EMA55 and VWAP with a death cross in force. The bounce was rejected near SMA200 resistance, and the MACD histogram, CMF and ADX are all fading. The bullish MACD cross and the +DI lead are real but weakening, so conviction is modest.
This is educational analysis and not financial advice.