SOXS 34-day bearish forecast — Nov 8, 2026
- Bias: Bearish
- Timeframe: 34 days (made Nov 8, 2026, target date Dec 11, 2026)
- Price at analysis: $70.95
- Price target: $60.00
- Expected range: $54.00 – $68.00
- Result: Pending — graded after the close on Dec 11, 2026
Get a free AI analysis of SOXS today
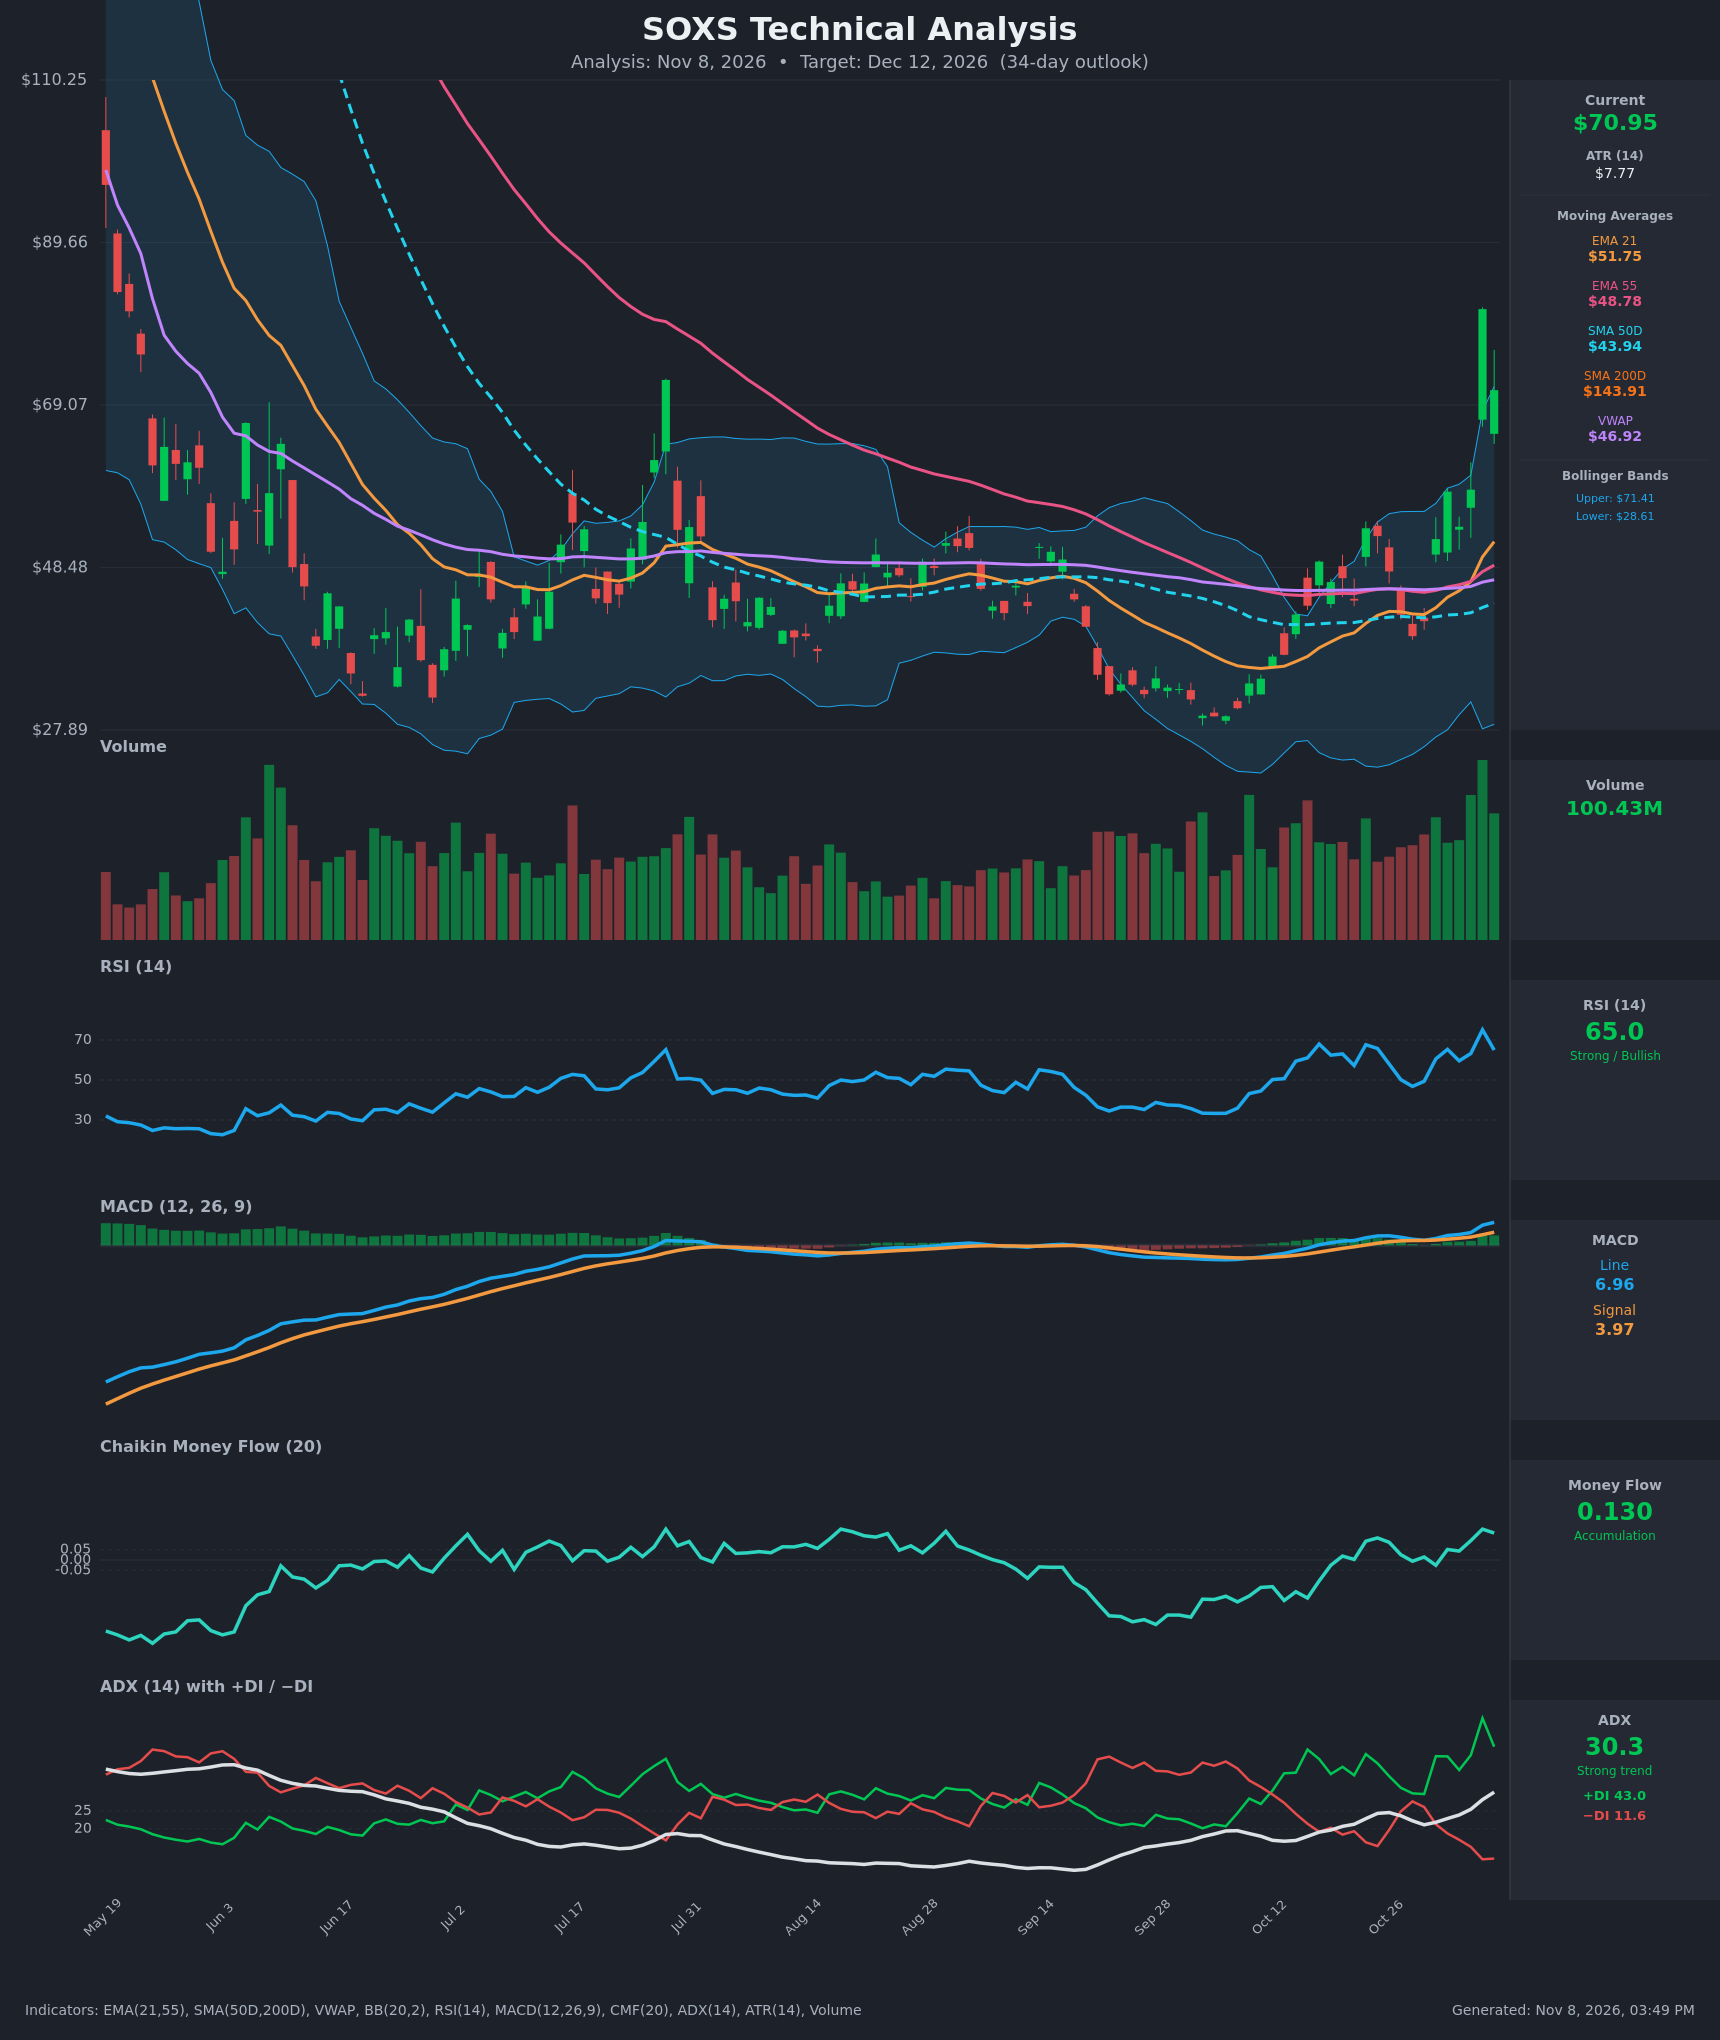
Analysis
TECHNICAL INDICATORS
- RSI (14): 64.97, down from a 75.1 peak on Nov 5. This is a bearish momentum roll-over from overbought, though the reading is still strong. [Neutral]
- 20 EMA (EMA 21: $51.75): Price at $70.95 is about 37% above the EMA 21 and about 45% above the EMA 55 ($48.78). The EMA 21 crossed above the EMA 55 on Nov 5, which is bullish. The stretch is extreme and mean-reversion risk is high. [Bullish]
- MACD: Line 6.96 is above signal 3.97 with an expanding positive histogram. The crossover came in late October, so momentum is firmly positive, but it is lagging after a one-day vertical spike. [Bullish]
- Bollinger Bands (20): Upper $71.41, lower $28.61. Price is pinned at the upper band after a violent expansion (band width is huge). A close at or beyond the upper band after a $81 spike and a rejection often marks a short-term exhaustion point. [Bearish]
- CMF (20): 0.130, above +0.05 and rising since early October. Buying pressure is real, but it is partly inflated by the climactic Nov 5 volume. [Accumulation]
- ADX (14): 30.3 and rising, with +DI 43.0 far above −DI 11.6. This is a strong uptrend in price, though ADX tends to peak right after spikes like this. [Strong Trend + Bullish]
- Volume: 100.43M, among the heaviest of the visible period. Volume surged on the spike candle, and the Nov 6 pullback came on similarly heavy volume. That points to a blow-off or climax pattern rather than quiet accumulation. [Climactic / Potentially Bearish]
DIVERGENCES & TRENDS
- Price made a new high on Nov 5 ($81.22), but the Nov 6 close ($70.95) gave back about 13% in one session. This long-upper-wick, bearish-reversal behavior is a warning.
- RSI peaked at 75.1 and is now rolling over. MACD and ADX are still rising, so there is no confirmed bearish divergence yet, only early momentum fatigue.
- SMA50D ($43.94) is far below SMA200D ($143.91), which is a long-standing death-cross state. Price is still well below the SMA200D, so the long-term trend is down. This is a leveraged inverse ETF with structural decay, and past spikes (the July high near $69, the Oct 22 and Oct 30 pops) all faded back toward the EMA/VWAP cluster.
- The EMA 21 crossed above the EMA 55 and price is above the VWAP ($46.92). Short-term trend structure is bullish.
- +DI has been above −DI since Oct 30, with the gap widening sharply on Nov 5.
CHART PATTERNS
- Base breakout: A multi-month base between roughly $38 and $55 (August to October) broke upward, similar to an ascending-triangle or consolidation breakout. The measured move is bullish in theory, but the breakout candle was a single-bar spike rather than an orderly range expansion.
- Blow-off top risk: The Nov 5 spike with a rejection candle resembles the early stage of a bearish double top, as in the reference diagram. A retest of $81 that fails would complete it. The neckline would be near $58 (the Nov 4 close), with a measured target in the low $40s to $50s.
- The Oct 22 and Oct 30 spikes retraced fully within days. This supports a fade scenario rather than a sustained trend.
POTENTIAL SCENARIOS
- Scenario 1: Bearish Mean-Reversion Fade — The spike exhausts at the upper Bollinger Band. Price retraces toward the $58 gap area and then the rising EMA 21, in line with prior spike behavior and the structural decay of a 3x inverse ETF. Trigger: a daily close below $64, then below $58.34. Target: $58-$60, with an extension to $52. Invalidation: a daily close above $81.22. (50% probability)
- Scenario 2: Bullish Trend Continuation — ADX above 30, +DI dominance, and a positive MACD and CMF fuel a second leg higher as semiconductors stay under pressure. Trigger: a close above $71.41 and then above $81.22 on strong volume. Target: $88-$95. Invalidation: a close below $58. (33% probability)
- Scenario 3: Neutral Volatile Consolidation — Price chops between about $58 and $72 as the EMAs catch up. Trigger: repeated closes between $58 and $72. Target: $62-$70. Invalidation: a close outside the $55-$75 band. (17% probability)
PRICE TARGETS
- Target Price: $60.00 (34-day horizon)
- Expected Range: $54.00 to $68.00 (width $14.00, about 19.7% of the current price, in line with 30-60 day guidance; the actual realized range may be wider given ATR of $7.77)
- Key Levels: Support at $51.75 (EMA 21), Resistance at $81.22 (Nov 5 spike high). The upper Bollinger Band at $71.41 is the first hurdle.
OVERALL BIAS
OVERALL BIAS: BEARISH - Price is stretched about 37% above its EMA 21 and sits at the upper Bollinger Band. It was rejected from $81 on climactic volume, RSI is rolling over from overbought, and prior spikes in this decaying inverse ETF have consistently faded. The trend indicators (ADX, MACD, CMF) remain bullish, so conviction is moderate.
This is educational analysis and not financial advice.