SPY 34-day bearish forecast — Nov 8, 2026
- Bias: Bearish
- Timeframe: 34 days (made Nov 8, 2026, target date Dec 11, 2026)
- Price at analysis: $735.29
- Price target: $722.00
- Expected range: $676.00 – $774.00
- Result: Pending — graded after the close on Dec 11, 2026
Get a free AI analysis of SPY today
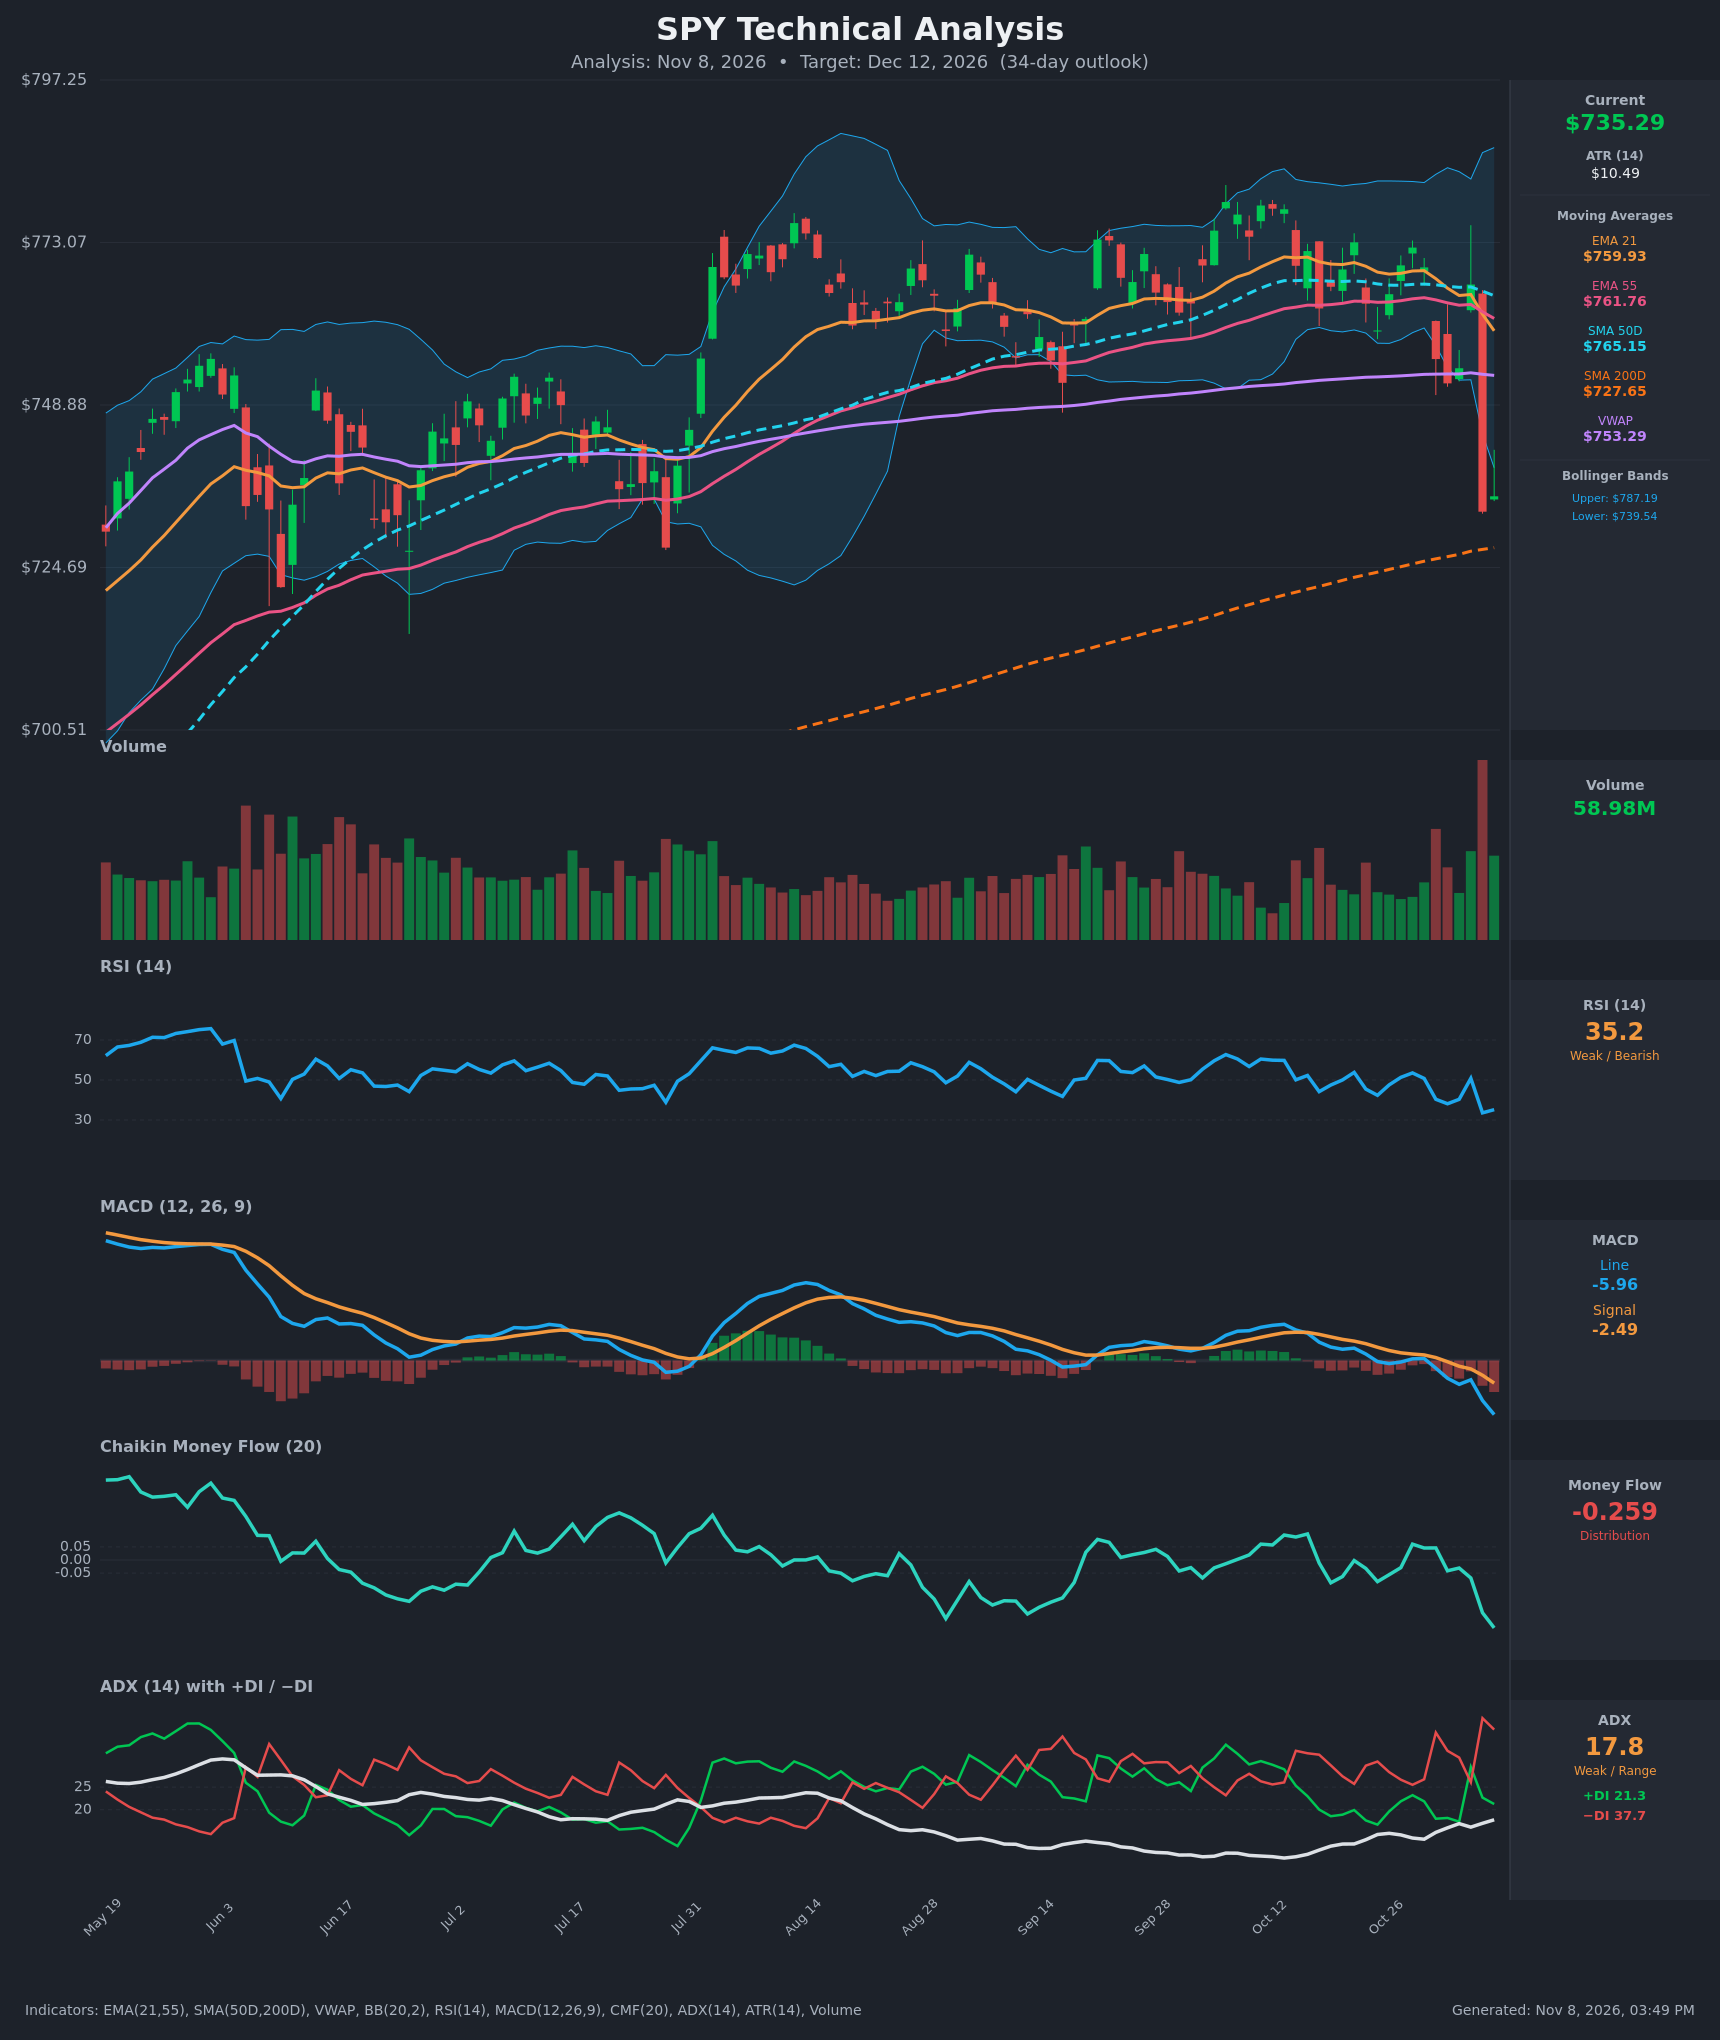
Analysis
TECHNICAL INDICATORS
- RSI (14): 35.18, down from 50.8 on Nov 4 and dipping to 33.6 on Nov 5. It is approaching oversold but not there yet. Momentum is falling and RSI has made lower highs since late October. [Bearish]
- 20 EMA: The closest value supplied is the EMA 21 at $759.93. Price at $735.29 is about 3.2% below it. The EMA 21 has just crossed below the EMA 55 ($761.76) and is sloping down, so it now acts as overhead resistance. [Bearish]
- MACD: Line -5.96 is below signal -2.49, a histogram of about -3.47 that has widened for several bars. The bearish crossover happened around Oct 30 to Nov 2, and the line is accelerating lower. [Bearish]
- Bollinger Bands (20): Upper $787.19, lower $739.54. Price ($735.29) closed below the lower band after a roughly 4.4% one-day drop. The bands are widening, which points to a volatility expansion. A close below the lower band in a downside breakout is more a sign of momentum than an automatic reversal, though it does raise the odds of a short-term bounce. [Bearish]
- CMF (20): -0.259, far below the -0.05 threshold and falling from near zero a week ago. This is heavy distribution and the weakest reading on the chart. [Distribution]
- ADX (14): 17.8, with −DI (37.7) well above +DI (21.3). ADX is below 20 and the trend is not yet established, but it is turning up and the directional bias is clearly bearish. Sellers are in control, although a low ADX caps conviction. [Weak Trend, Bearish Direction]
- Volume: 58.98M on the latest bar. The Nov 5 breakdown candle carried the largest volume on the chart, a high-volume red bar that signals institutional selling. Volume on the follow-through bar has eased. [Bearish – distribution/capitulation-type selling]
Other levels:
- VWAP: $753.29, above price, so it is overhead resistance.
- SMA 50D / SMA 200D: $765.15 and $727.65. Price is above the SMA200 (long-term uptrend still intact) but below the SMA50. There is no death cross, and the SMA200 sits only 1% below price as the next major support.
DIVERGENCES & TRENDS
- No bullish divergence yet. RSI (35) and price both made new lows together. MACD and CMF are also at multi-month lows. This is confirmation of weakness, not a reversal signal.
- Breakdown through a range. From August to early November price held a roughly $750 to $775 range. The Nov 5 gap and slide closed well below the $750 floor, which is a bearish break.
- Moving-average structure turning down. EMA21 crossed below EMA55 on Nov 5 to Nov 6. Price is below EMA21, EMA55, SMA50 and VWAP. The SMA50 is rolling over toward flat.
- DI shift. −DI has been above +DI almost continuously since Oct 19, and the spread widened sharply on Nov 5. ADX is rising from a low base, which suggests a trend is beginning.
- CMF trend. It has been mostly negative for two weeks and made a fresh low at -0.259, so sellers are consistently controlling closes.
- Counterpoint. Price is below the lower Bollinger Band and RSI is near 33 to 35, so mean-reversion bounces toward $750 to $753 are likely along the way.
CHART PATTERNS
- Bearish Triple Top / rectangle breakdown (closest match in the reference diagram). Highs near $772 to $780 were rejected repeatedly from August through October, with a floor near $750. The Nov 5 drop below $750 is the pattern's downside break. The measured move is the range height of about $25 to $30 subtracted from the $750 breakdown level, which gives about $720 to $725. This lines up closely with the SMA200 at $727.65.
- No reliable reversal pattern is visible yet. There is no double bottom or inverted head and shoulders. A long-wick or hammer-type candle on Nov 6 hints at a short-term bounce attempt, but it is not confirmed.
POTENTIAL SCENARIOS
- Scenario 1: Bearish Range Breakdown Continuation — Price makes a weak relief bounce to the $745 to $753 area (lower Bollinger Band / VWAP), fails, and rolls over to test and probably undercut the SMA200. Trigger: failure at $740 to $753 and a daily close below $727.65. Target: $722 initially (measured move), then $690 to $700 if the SMA200 breaks. Invalidation: daily close above $753.29 (VWAP) with CMF turning back above zero. (50% probability)
- Scenario 2: Bullish Oversold Reversal — The SMA200 and oversold RSI attract dip buyers, and price reclaims the lower band and then the EMA21 and EMA55 zone. Trigger: close above $753 on rising volume, with RSI back above 50 and a MACD histogram turn. Target: $760 to $766 (EMA cluster / SMA50), with an extension to $775. Invalidation: close below $727 or a failed bounce at $745. (35% probability)
- Scenario 3: Neutral Choppy Base Above the SMA200 — Price oscillates between the SMA200 (about $728) and VWAP (about $753) while the breakdown is digested. Trigger: low-volume consolidation with ADX staying under 20. Target: $730 to $750. Invalidation: close beyond either boundary. (15% probability)
PRICE TARGETS
- Target Price: $722.00 (34-day horizon, about 1.8% below current)
- Expected Range: $676.00 to $774.00 (about $98 wide, about 13.3% of the current price, in line with the 30–60 day guidance)
- Key Levels: Support at $727.65 (SMA200), Resistance at $753.29 (VWAP)
Secondary levels: further support at $700 and $690, and resistance at $759.93 to $765.15 (EMA21/EMA55/SMA50 cluster).
OVERALL BIAS
OVERALL BIAS: BEARISH - Price broke below its two-to-three month range on the heaviest volume on the chart. It sits below every key moving average and VWAP, with a bearish MACD crossover, −DI dominance and deep CMF distribution (-0.259). The measured-move target near $722 aligns with the SMA200, though an oversold bounce first is likely and the low ADX limits conviction.
This is educational analysis and not financial advice.