XLF 34-day bullish forecast — Nov 8, 2026
- Bias: Bullish
- Timeframe: 34 days (made Nov 8, 2026, target date Dec 11, 2026)
- Price at analysis: $57.16
- Price target: $58.70
- Expected range: $53.80 – $61.60
- Result: Pending — graded after the close on Dec 11, 2026
Get a free AI analysis of XLF today
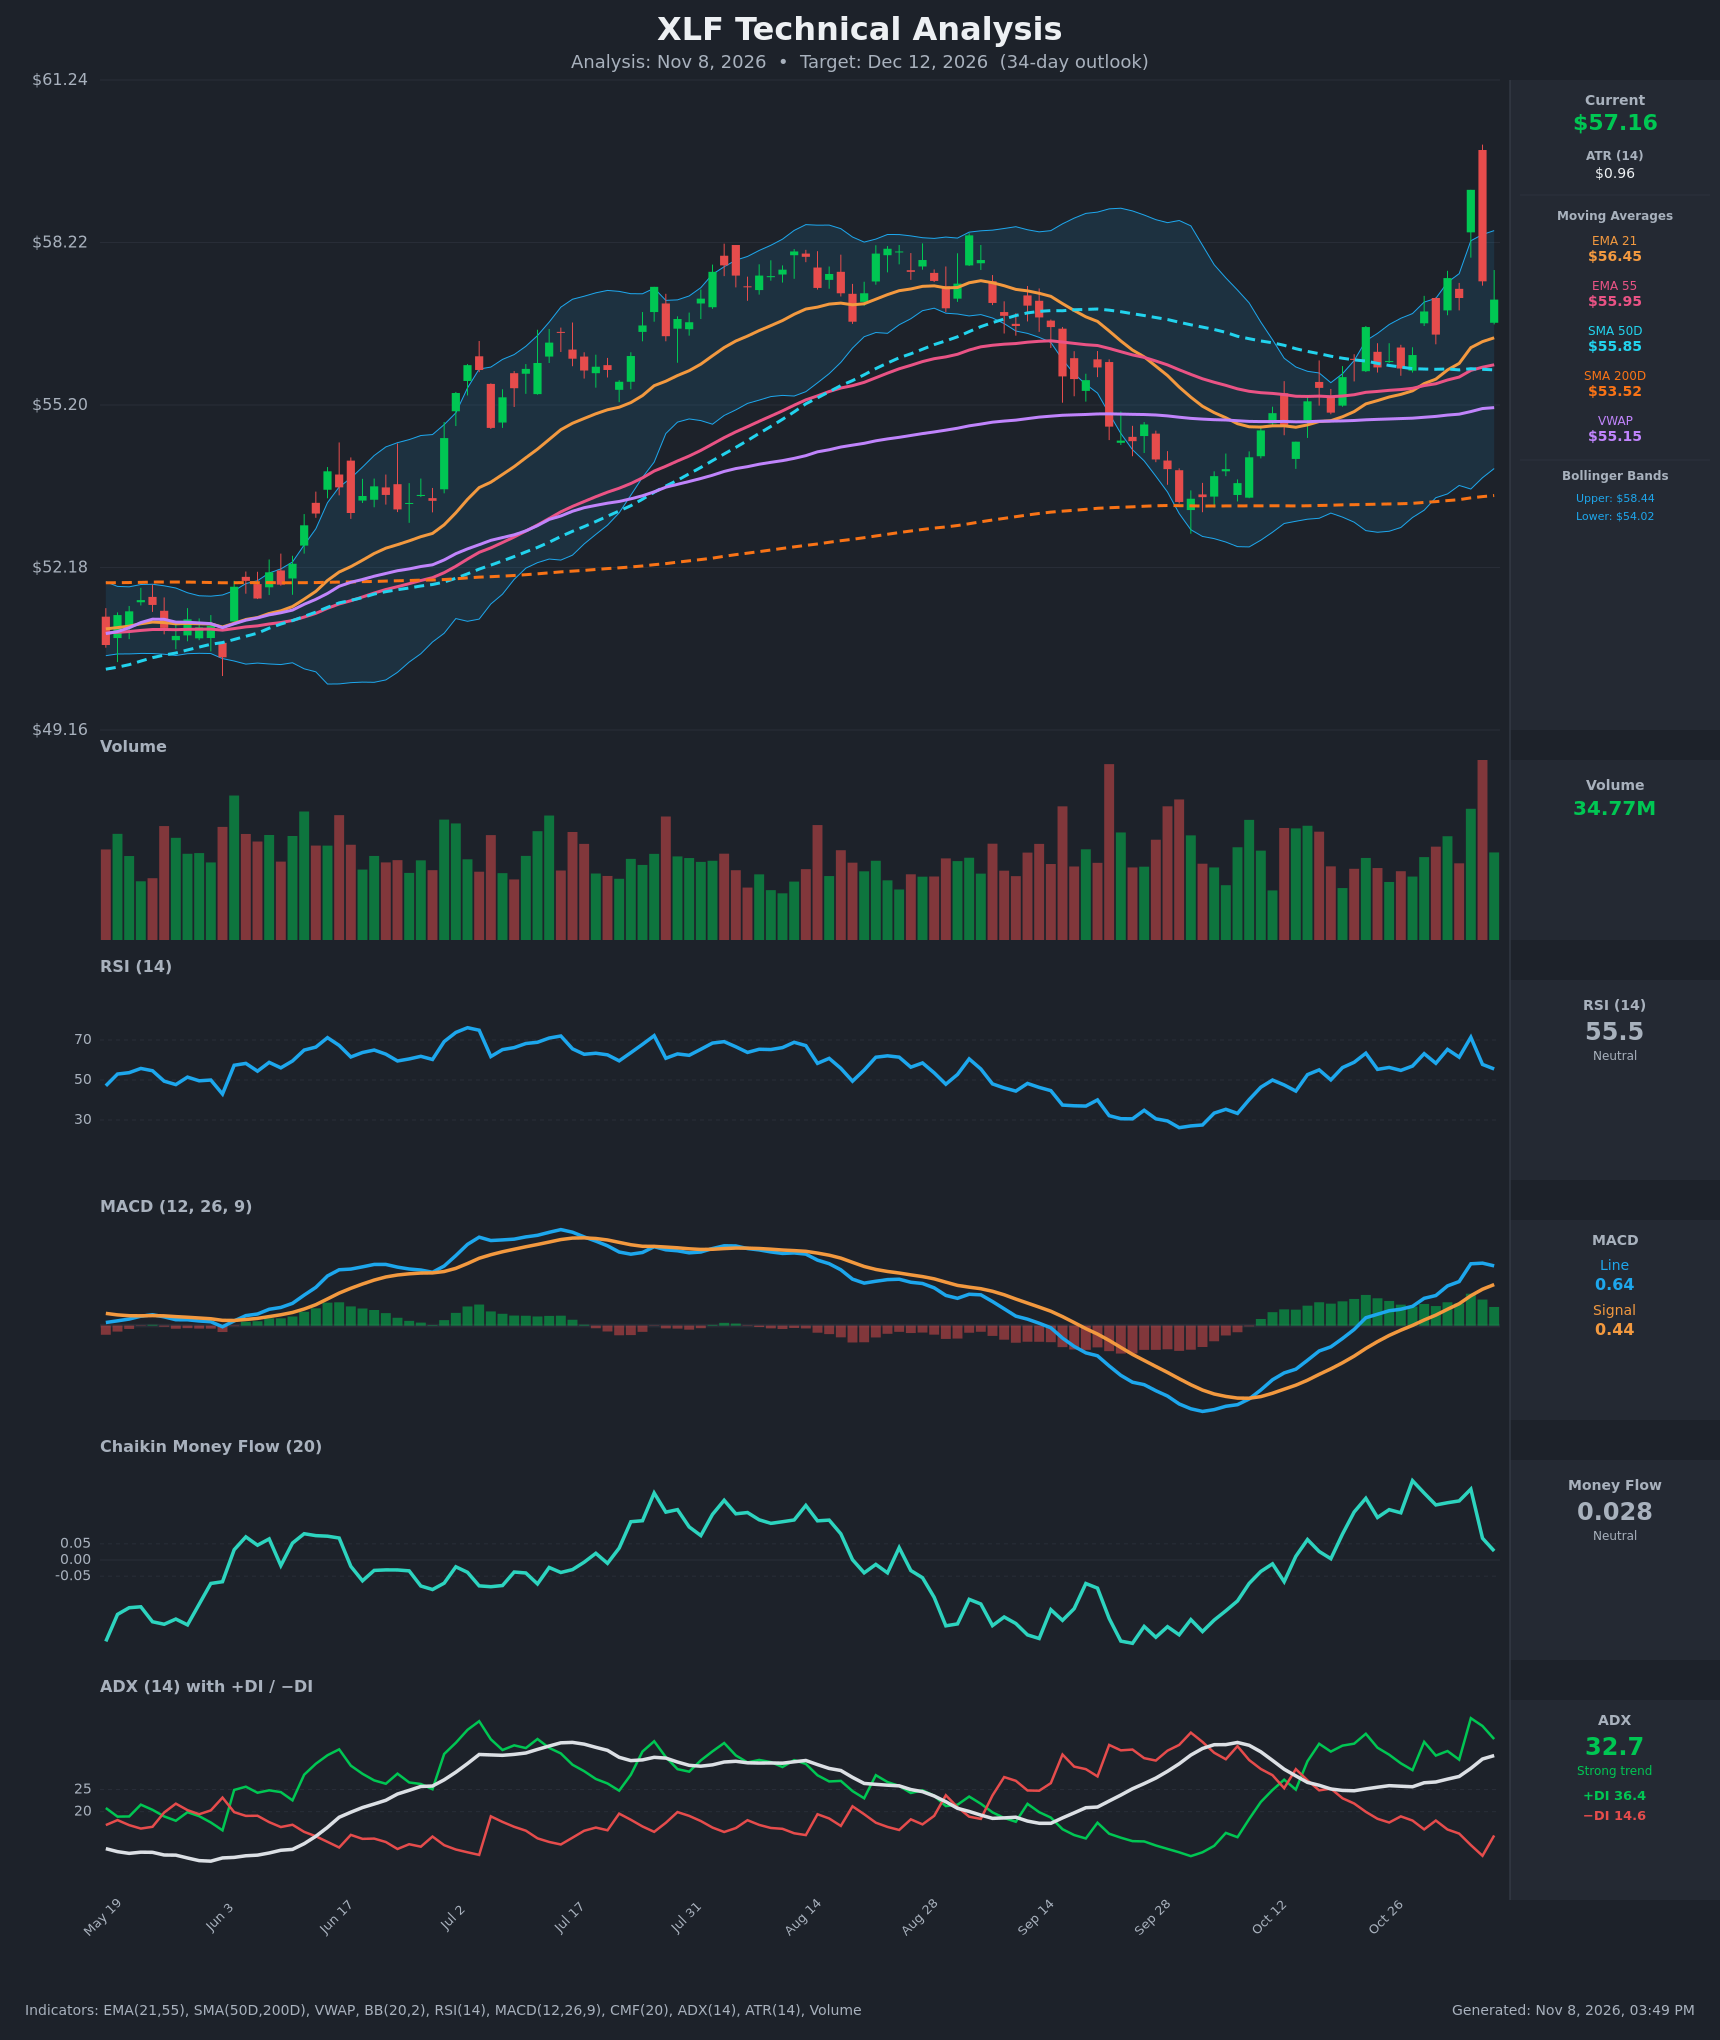
Analysis
TECHNICAL INDICATORS
- RSI (14): 55.52, down from an overbought 71.4 on Nov 4 and now mid-range. It has cooled without breaking below 50, so momentum is still constructive but no longer stretched. [Bullish]
- 20 EMA: The chart shows the 21 EMA at $56.45, with price at $57.16 above it. The EMA is rising and sits above the 55 EMA ($55.95), so it is acting as dynamic support on any pullback. [Bullish]
- MACD: The line (0.644) is above the signal (0.443) after a bullish crossover on Oct 28. The histogram is positive at about +0.20, but the line has flattened (0.666, 0.673, 0.644), so momentum is plateauing. [Bullish]
- Bollinger Bands (20): The bands are $54.02 / $58.44 and price is in the upper half, about 71% of the way up the band. The Nov 4 spike pierced the upper band and closed back inside. The bands are widening, consistent with a new trend phase. [Bullish]
- CMF (20): 0.028, inside the ±0.05 neutral zone. It has fallen from 0.219 on Nov 4 as buying pressure faded after the spike. It is still positive. [Neutral]
- ADX (14): 32.7 and rising, a strong trend. +DI at 36.4 is well above −DI at 14.6, so bulls are firmly in control. The −DI is at a multi-month low. [Strong Trend – Bullish]
- Volume: 34.77M on the latest green bar. The Nov 4 spike bar had the heaviest volume on the chart, and its red close from the high shows heavy distribution or profit-taking. Follow-through volume is moderate. [Neutral to slightly Bullish]
DIVERGENCES & TRENDS
- There is no classic divergence. Price is making higher highs and RSI and MACD are confirming, although RSI is now below its Nov 4 peak as price holds near $57.
- Trend structure: The 50-day SMA ($55.85) is above the 200-day SMA ($53.52), so the golden cross is already in place. Price is above all MAs and VWAP ($55.15), with EMA21 > EMA55 > SMA50D. This is a clean bullish stack.
- Crossovers: MACD crossed above its signal on Oct 28. Price reclaimed the 50-day SMA and EMAs in mid-October, and +DI has been above −DI since then.
- Caution: The Nov 4 candle ran to about $59.20 and closed well off the high on very heavy volume, a blow-off or exhaustion type bar. CMF dropped from 0.219 to 0.028 and the MACD line has flattened. These suggest a short-term pause or retest of the $56.5 area is likely before any continuation.
CHART PATTERNS
- Bullish Double Bottom (reversal): Price formed a double bottom near $53.3 in late September and early October, with the 200-day SMA acting as support. It then broke out above the neckline at about $56 to $56.5. The measured move (about $3.2 of height) points to roughly $59.5 to $59.7.
- Prior range: The July–August highs near $58.2 were cleared on the recent surge. That level should now act as support.
- Spike candle: The Nov 4 reversal candle at $59.20 marks near-term resistance. A consolidation or bullish-flag-like pullback above $56.5 would be a healthy continuation setup. A close below $55.9 would weaken the pattern.
POTENTIAL SCENARIOS
- Scenario 1: Bullish Trend Continuation — The pullback holds at the 21 EMA and the double-bottom breakout extends, with +DI dominance and ADX above 30 supporting the trend. Trigger: a hold above $56.45 followed by a close above $58.50 (the upper Bollinger Band). Target: $59.20 first, then $60.00 to $60.50 (measured move). Invalidation: a daily close below $55.90. (50% probability)
- Scenario 2: Neutral Consolidation After Spike — Price digests the Nov 4 spike in a $56.00 to $58.50 range while the MAs catch up and RSI resets toward 50. Trigger: failure to clear $58.50 on volume, with CMF staying near zero. Target: $56.50 to $57.50 mid-range. Invalidation: a close above $58.80 or below $55.80. (25% probability)
- Scenario 3: Bearish Failed Breakout — The Nov 4 blow-off proves to be the top, and distribution pushes price back through the moving averages. Trigger: a daily close below $56.00 with CMF turning below -0.05. Target: $55.00 to $54.00 (VWAP, then the lower Bollinger Band). Invalidation: a recovery above $58.00. (25% probability)
PRICE TARGETS
- Target Price: $58.70 (34-day horizon, Dec 12)
- Expected Range: $53.80 to $61.60. The width is $7.80, or about 13.6% of the current price, which fits the 30-60 day guidance of 12-18%.
- Key Levels: Support at $56.45 (21 EMA, then $55.90 at the 50-day SMA and 55 EMA). Resistance at $59.20 (Nov 4 spike high).
OVERALL BIAS
OVERALL BIAS: BULLISH - Price is above all key moving averages with the golden cross intact, MACD is positive, and ADX is at 32.7 with +DI far above −DI, while the double-bottom breakout targets about $59.5 or higher. Conviction is modest because the Nov 4 reversal candle and fading CMF make a retest of $56.5 likely first.
This is educational analysis and not financial advice.