PLTR 55-day bearish forecast — Nov 8, 2026
- Bias: Bearish
- Timeframe: 55 days (made Nov 8, 2026, target date Jan 1, 2027)
- Price at analysis: $160.38
- Price target: $153.00
- Expected range: $139.00 – $167.00
- Result: Pending — graded after the close on Jan 1, 2027
Get a free AI analysis of PLTR today
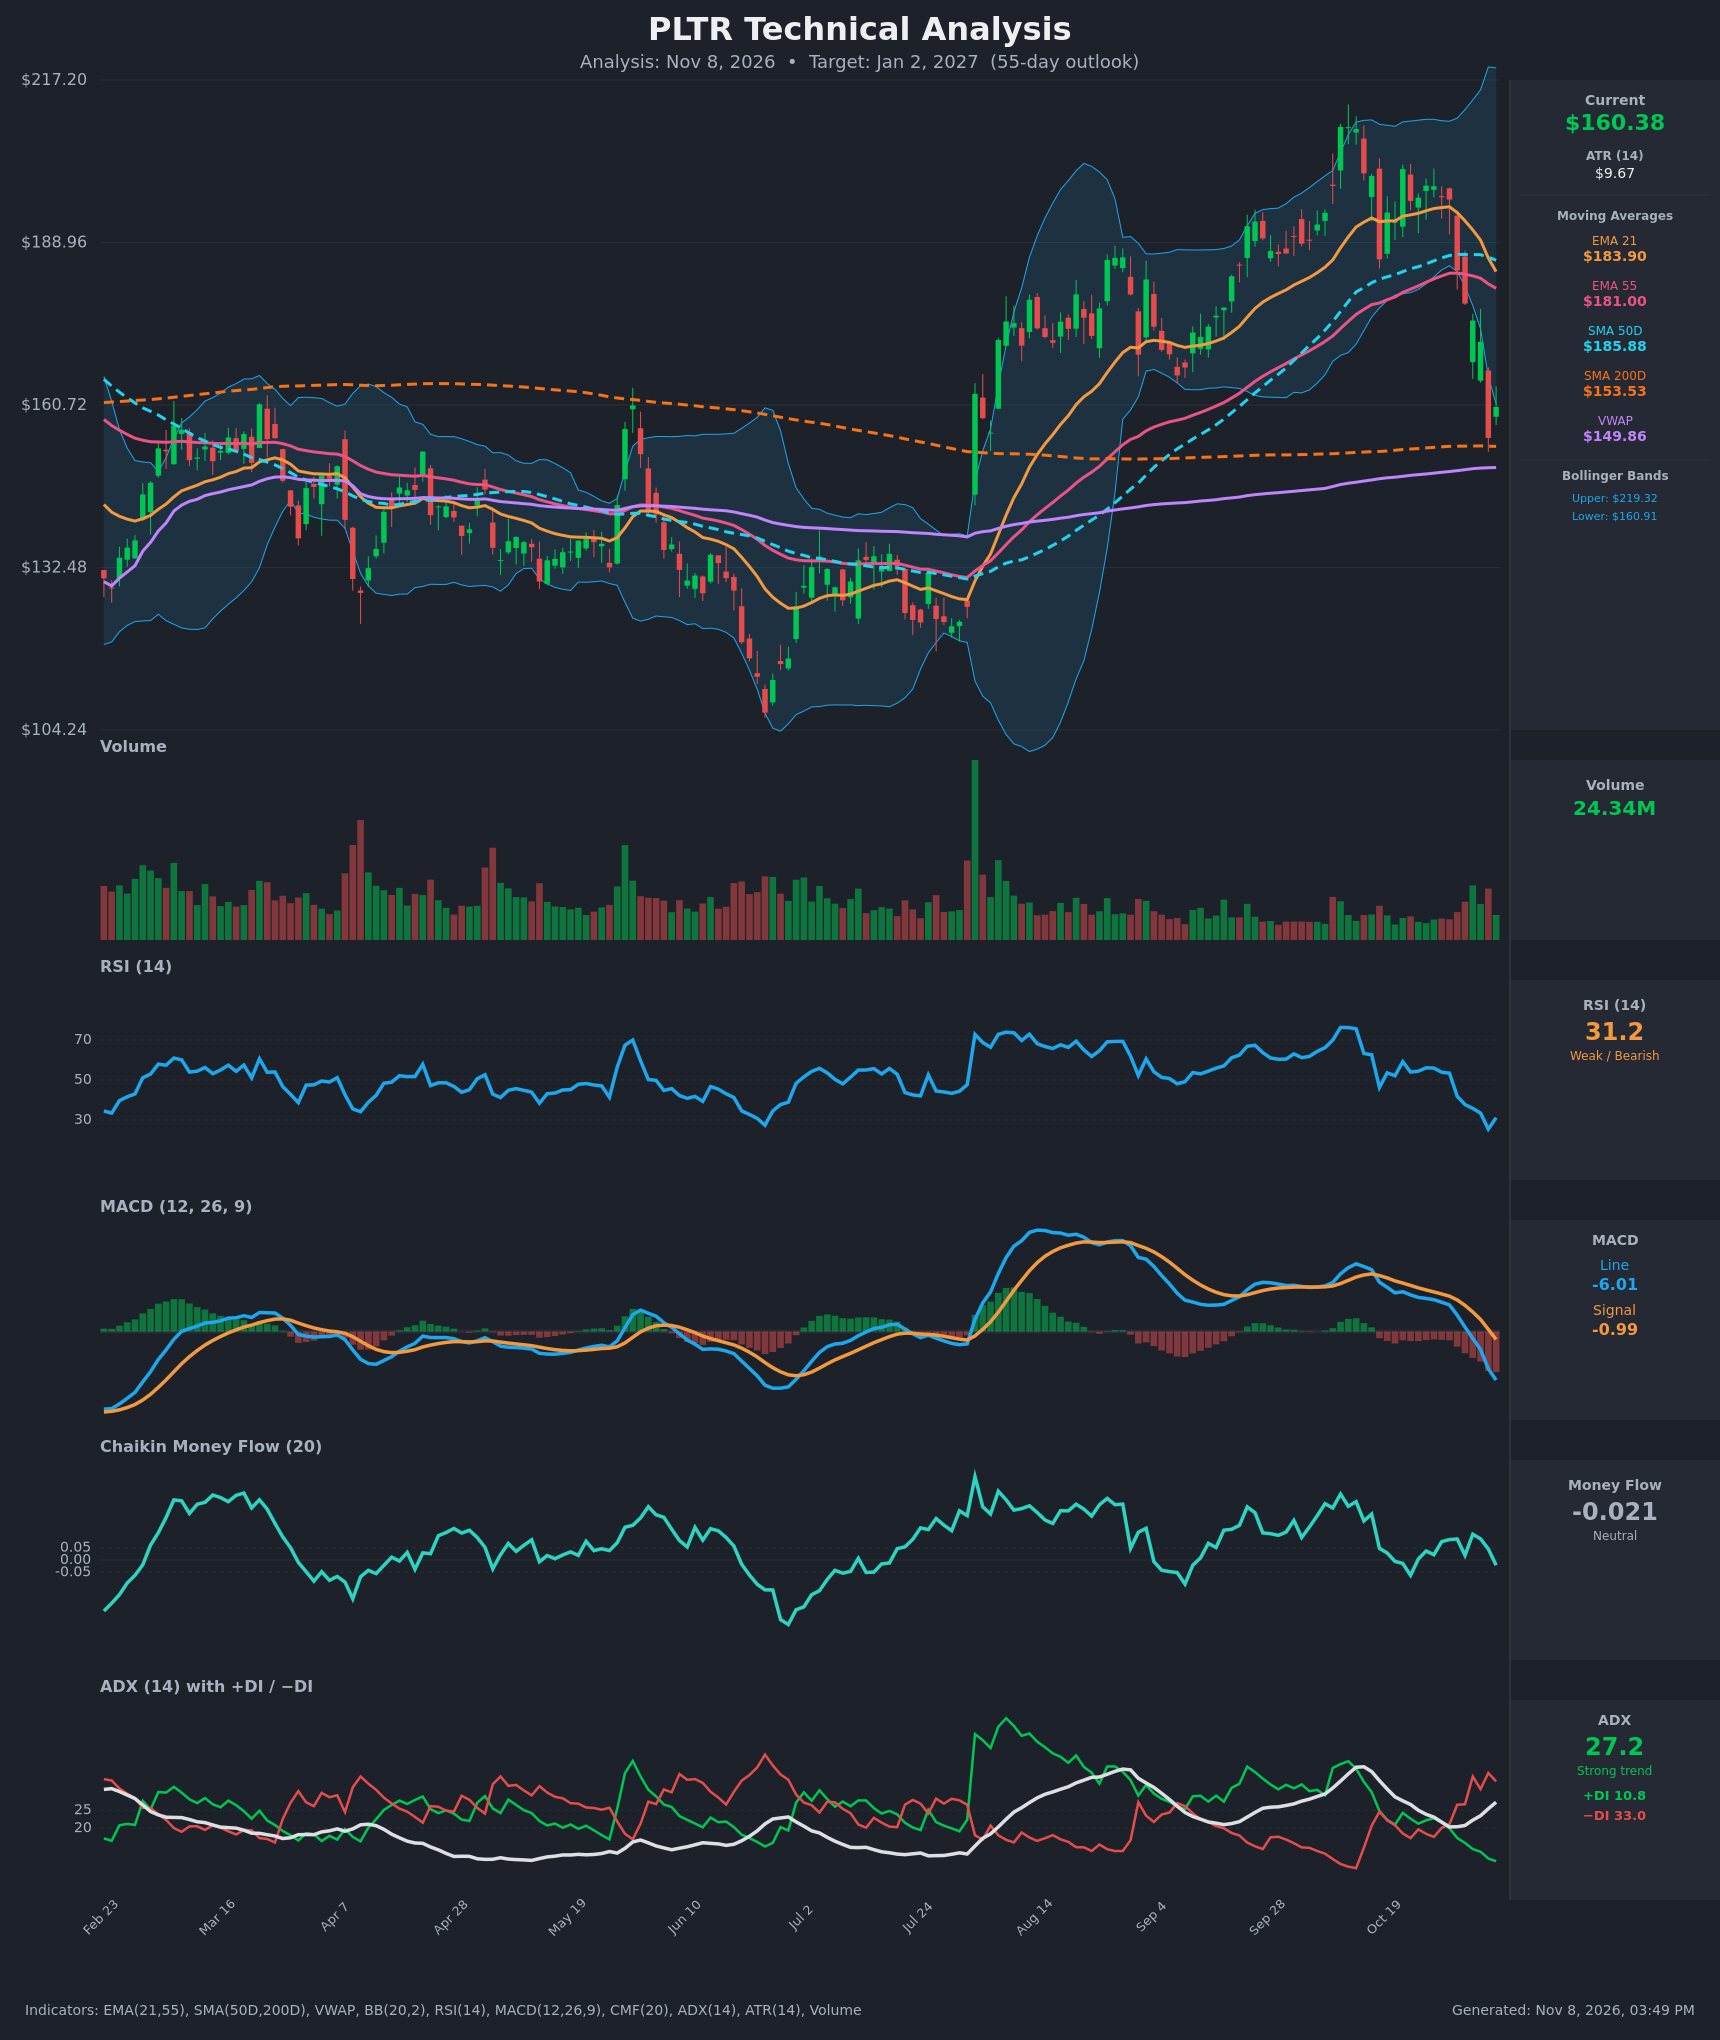
Analysis
TECHNICAL INDICATORS
- RSI (14): 31.17, bouncing off 25.4 on Nov 5 but still just above oversold. It fell from ~54 on Oct 29 to 31 in about a week, which shows heavy downside momentum. A move back above 40 would be the first sign of stabilization. [Bearish]
- 20 EMA (EMA 21): $183.90, with price about 12.8% below it. The EMA is rolling over and acts as overhead resistance. EMA 55 ($181.00) is just below it, and the two are converging, so a bearish EMA21/55 cross is close. [Bearish]
- MACD: Line -6.01 vs signal -0.99. The line crossed below the signal around Nov 3 and has gone negative. The histogram is widening to the downside, and the line is far below the signal, so momentum is still accelerating down. [Bearish]
- Bollinger Bands (20): Upper $219.32, lower $160.91. Price at $160.38 is sitting right at or just under the lower band after a sharp expansion, so the band is being "walked." That signals an oversold, stretched condition, but it can produce either a snap-back or a continued band-walk in a strong downtrend. [Neutral]
- CMF (20): -0.021, neutral (between ±0.05). It has faded from +0.105 on Nov 3. That means no accumulation on the dip, but also no heavy distribution yet. [Neutral]
- ADX (14): 27.2 and rising (up from 20.3 on Oct 29). −DI at 33.0 is well above +DI at 10.8, so bears are firmly in control and the downtrend is strong. [Strong Trend – Bearish]
- Volume: 24.34M on the latest bar, a recovery bounce candle after the heavy-volume decline. Volume has expanded on the red sell-off candles (Oct 30 – Nov 5). Heavier volume on down days confirms the selling pressure, and the small green bounce lacks follow-through so far. [Bearish-leaning]
DIVERGENCES & TRENDS
- No bullish RSI divergence yet. RSI made a lower low (25.4) as price made a lower low, so the move is confirmed rather than diverging.
- Moving averages: Price has lost EMA21, EMA55 and SMA50D within 7 sessions. SMA50D ($185.88) is rolling over, but still sits above SMA200D ($153.53), so there is no death cross yet. A death cross is unlikely within weeks, but the SMA50D–SMA200D gap is narrowing.
- Long-term support: Price is above SMA200D (+4.5%) and above VWAP ($149.86), so the long-term structure is not broken. The Nov 5 low (~$155) came very close to SMA200D, which gave a bounce.
- DI and ADX: The −DI/+DI crossover occurred around Oct 30, and ADX has since risen back above 25, confirming a trend rather than noise.
- MACD: The bearish crossover is confirmed and the line is still falling. The MACD line has fallen well below zero, so there is no sign of a turn yet.
- Gap fill: The chart shows a big gap/surge in late July from ~$130–150. The current area ($150–160) sits near the top of that gap, which is a possible support zone.
CHART PATTERNS
- Bearish Double Top (reversal): Peaks near ~$207 (early Oct) and ~$202 (Oct 21) with a neckline around $175–180. The break below this neckline on Oct 30 – Nov 5 triggers the pattern. A measured move from roughly $205 to $178 is about $27, which projects to about $150–152 – near SMA200D and VWAP.
- Context: The decline is a sharp breakdown from the upper channel, not a gradual rollover. Rebounds into the broken neckline / EMA cluster ($175–184) would likely be sold as a back-test.
- No clear bullish reversal pattern is forming yet. A Bullish Double Bottom or Falling Wedge would only be valid if price holds ~$153 and builds a base.
POTENTIAL SCENARIOS
- Scenario 1: Bearish Double-Top Measured Move — The breakdown continues after a brief relief bounce, which fails at the broken neckline or the $171–176 area. Price tests and probes SMA200D/VWAP. Trigger: daily close below $153.50 (SMA200D). Target: $150, then $140 on a break. Invalidation: daily close above $176 (reclaiming the neckline). (50% probability)
- Scenario 2: Bullish Oversold Mean-Reversion Bounce — RSI near 30 plus the lower Bollinger Band and SMA200D support produce a multi-week rebound back toward the EMA cluster. Trigger: close above $172 with MACD histogram shrinking and RSI above 45. Target: $180–184 (EMA21/EMA55/SMA50D). Invalidation: close below $153. (35% probability)
- Scenario 3: Neutral Base Between SMA200D and Broken Support — Price chops between ~$150 and $172 as the trend exhausts. Trigger: ADX rolls over below 25 with price oscillating between $150–172. Target: $160–165. Invalidation: close above $176 or below $148. (15% probability)
PRICE TARGETS
- Target Price: $153.00 (55 days, Jan 2, 2027)
- Expected Range: $139.00 to $167.00 (width $28.00, ~17.5% of the current price, consistent with the 30–60 day guidance)
- Key Levels: Support at $153.53 (SMA200D; next at $149.86 VWAP), Resistance at $171.70
OVERALL BIAS
OVERALL BIAS: BEARISH - A confirmed bearish MACD crossover, −DI (33.0) far above +DI (10.8) with ADX rising above 25, loss of all short-term moving averages, and a double-top breakdown point to continued downside toward the $150 area. Oversold RSI and SMA200D support make a bounce likely, but it is expected to stall below $176.
This is educational analysis and not financial advice.