NVDA 55-day bearish forecast — Nov 8, 2026
- Bias: Bearish
- Timeframe: 55 days (made Nov 8, 2026, target date Jan 1, 2027)
- Price at analysis: $186.64
- Price target: $180.00
- Expected range: $166.00 – $198.00
- Result: Pending — graded after the close on Jan 1, 2027
Get a free AI analysis of NVDA today
Analysis
TECHNICAL INDICATORS
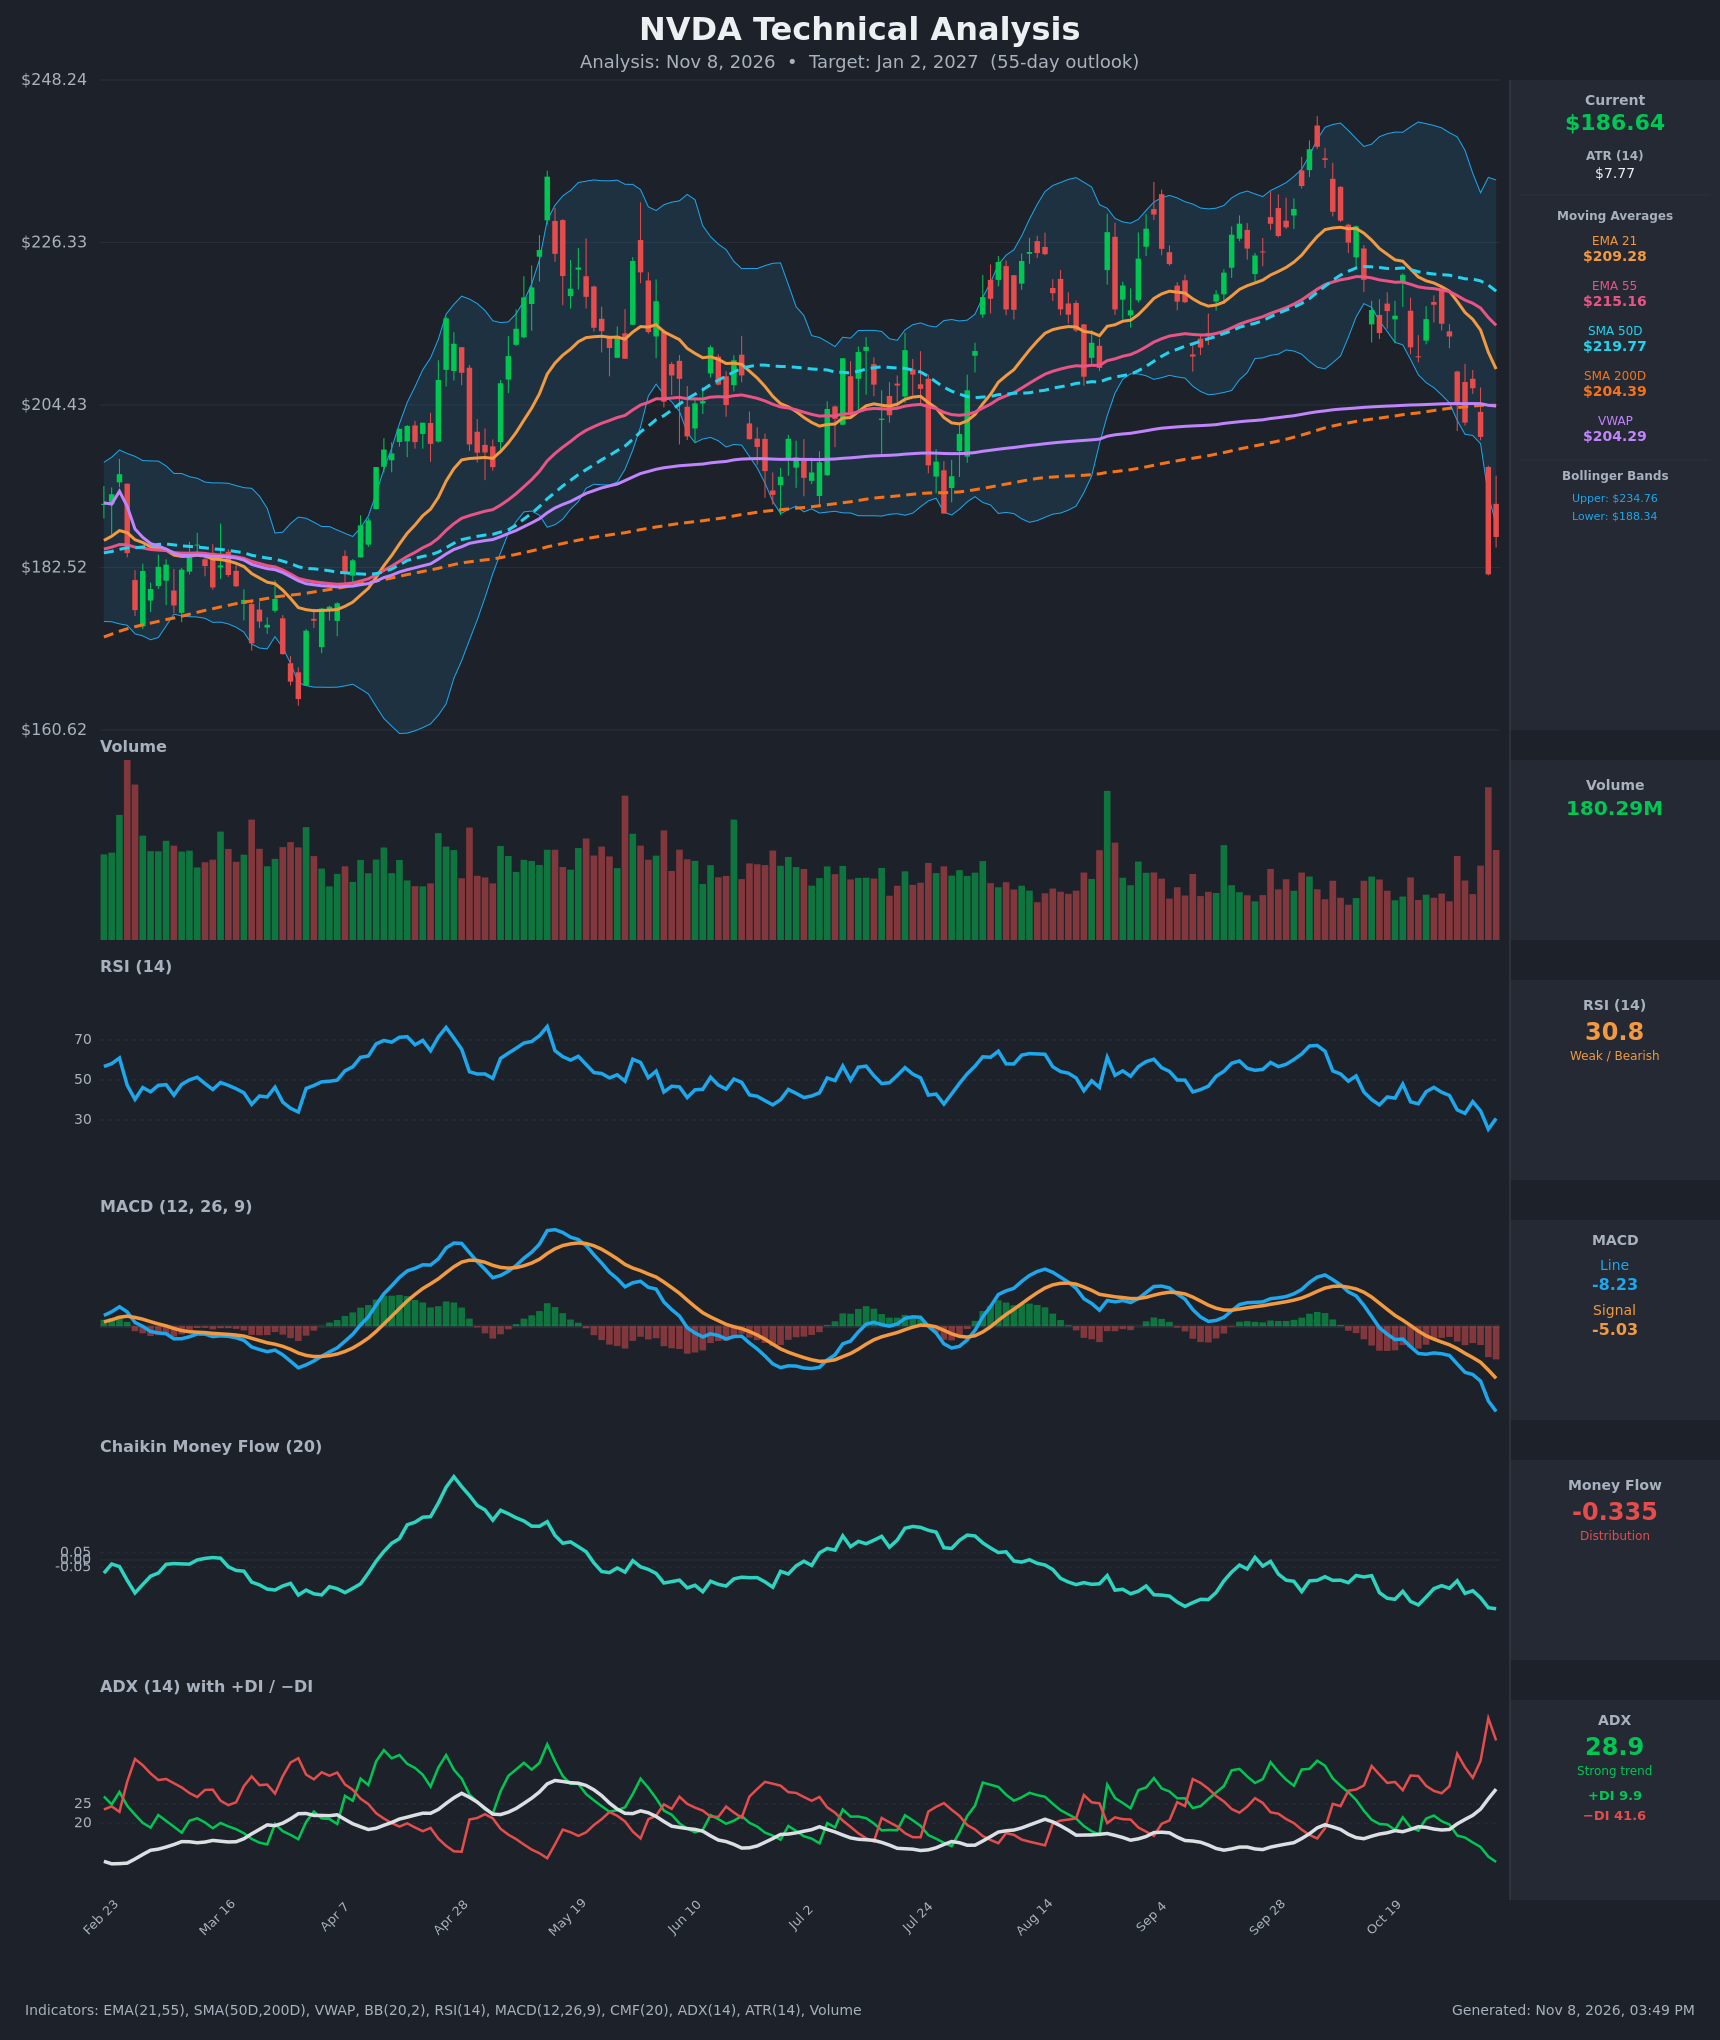
- RSI (14): 30.77, rebounding slightly from 25.4 on Nov 5, which was a deeply oversold reading. It has fallen from about 47 in late October. It is near oversold but has not shown a bullish divergence. [Bearish]
- 20 EMA (EMA 21): $209.28, with price about 10.8% below it. The EMA 21 crossed below the EMA 55 ($215.16) around Oct 30, a bearish crossover. Both now slope down and act as overhead resistance. [Bearish]
- MACD: Line -8.23 is below signal -5.03, and the histogram is about -3.2 and widening. The bearish cross happened around Oct 19 and the gap keeps growing, so downside momentum is accelerating. [Bearish]
- Bollinger Bands (20): Upper $234.76 and lower $188.34. Price at $186.64 sits just below the lower band after a sharp expansion. This shows a strong downside breakout and a stretched move. A short-term bounce is possible, but "walking the band" is common in strong downtrends. [Bearish]
- CMF (20): -0.335, well below -0.05 and at its lowest of the year. It has been negative for months, which points to heavy, persistent distribution. [Distribution]
- ADX (14): 28.9 and rising (from about 18 two weeks ago), with -DI at 41.6 far above +DI at 9.9. This is a strong, newly established downtrend with bears in full control. [Strong Trend – Bearish]
- Volume: 180.29M, with the Nov 5 breakdown on one of the largest volume spikes of the year. Heavy volume on the decline confirms the selling and may reflect partial capitulation. [Bearish – confirmed selling, possible exhaustion]
Other levels:
- Price is below the SMA200 ($204.39), VWAP ($204.29), SMA50 ($219.77) and both EMAs.
- The SMA50 is still above the SMA200, so there is no death cross yet. The gap is narrowing, and a cross is possible within the 55-day window.
DIVERGENCES & TRENDS
- There is no bullish RSI or MACD divergence. Both made new lows along with price, so momentum confirms the move.
- MACD and the histogram are making fresh lows, and CMF is at a yearly low. ADX is rising with -DI dominant, so the trend is strengthening.
- Price broke below the SMA200 and VWAP for the first time since the Jul 24 dip and closed below the lower Bollinger Band. This is a major support break.
- The EMA 21/55 bearish cross is confirmed. The SMA50/200 death cross is the next risk.
- Counter-signal: RSI near 30 and price outside the lower band make a relief bounce toward the EMA 21 or SMA200 likely at some point. In strong ADX downtrends, such bounces typically fail below the declining averages.
CHART PATTERNS
- Bearish double top (broad): Highs around $230 (late Apr/May) and about $245 (early Oct) with a neckline near $190 (the Jul lows). Price has now broken through that neckline. The measured move (about $50) points toward ~$140 over a longer horizon, so only part of it is likely within 55 days.
- Bearish expanding triangle / broad range breakdown: Since June, price swung between roughly $190 and $245 with wider swings. The downside break on heavy volume resembles the bearish expanding triangle in the diagram.
- Retest risk: After a breakdown, a retest of the broken level ($200–$205, the SMA200/VWAP zone) is common before the next leg down.
POTENTIAL SCENARIOS
- Scenario 1: Bearish Trend Continuation — Price bounces weakly toward $195–$200, fails at the declining EMA 21 or the SMA200/VWAP zone, then rolls over. This is consistent with the broken neckline and strong ADX with -DI dominance. Trigger: close below $181.60 (the Nov 5 low close), or rejection near $200. Target: $170–$176, with an extension toward $160–$165. Invalidation: daily close above $205. (50% probability)
- Scenario 2: Bullish Oversold Relief Rally — Capitulation volume and RSI near 25–30 spark a mean-reversion bounce toward the declining EMAs. Trigger: RSI above 40 with a close above $195 and a MACD histogram turning up. Target: $205–$209 (the SMA200 and EMA 21). Invalidation: failure to hold $181.60. (32% probability)
- Scenario 3: Neutral Basing Range — Price chops between roughly $175 and $200 as selling exhausts without a firm recovery. Trigger: a series of closes inside $178–$198 with ADX fading below 25. Target: $185–$190. Invalidation: a close outside $175–$200. (18% probability)
PRICE TARGETS
- Target Price: $180.00 (55-day horizon, ~3.6% below current)
- Expected Range: $166.00 to $198.00 (width $32 ≈ 17.1% of current price, consistent with the 30–60 day guidance of 12–18%)
- Key Levels: Support at $181.60 (Nov 5 closing low, then ~$176 and the $165 prior lows), Resistance at $204.39 (SMA200/VWAP zone, with minor resistance at $188.34 and $195)
OVERALL BIAS
OVERALL BIAS: BEARISH - Price is below every moving average with a fresh EMA 21/55 bearish cross, MACD at new lows, CMF at -0.335, and a rising ADX with -DI far above +DI. The neckline of a broad double top broke on heavy volume. An oversold bounce toward $195–$205 is likely, but the net direction over 55 days leans lower.
This is educational analysis and not financial advice.