QBTS 55-day bearish forecast — Nov 8, 2026
- Bias: Bearish
- Timeframe: 55 days (made Nov 8, 2026, target date Jan 1, 2027)
- Price at analysis: $10.68
- Price target: $9.90
- Expected range: $9.10 – $11.00
- Result: Pending — graded after the close on Jan 1, 2027
Get a free AI analysis of QBTS today
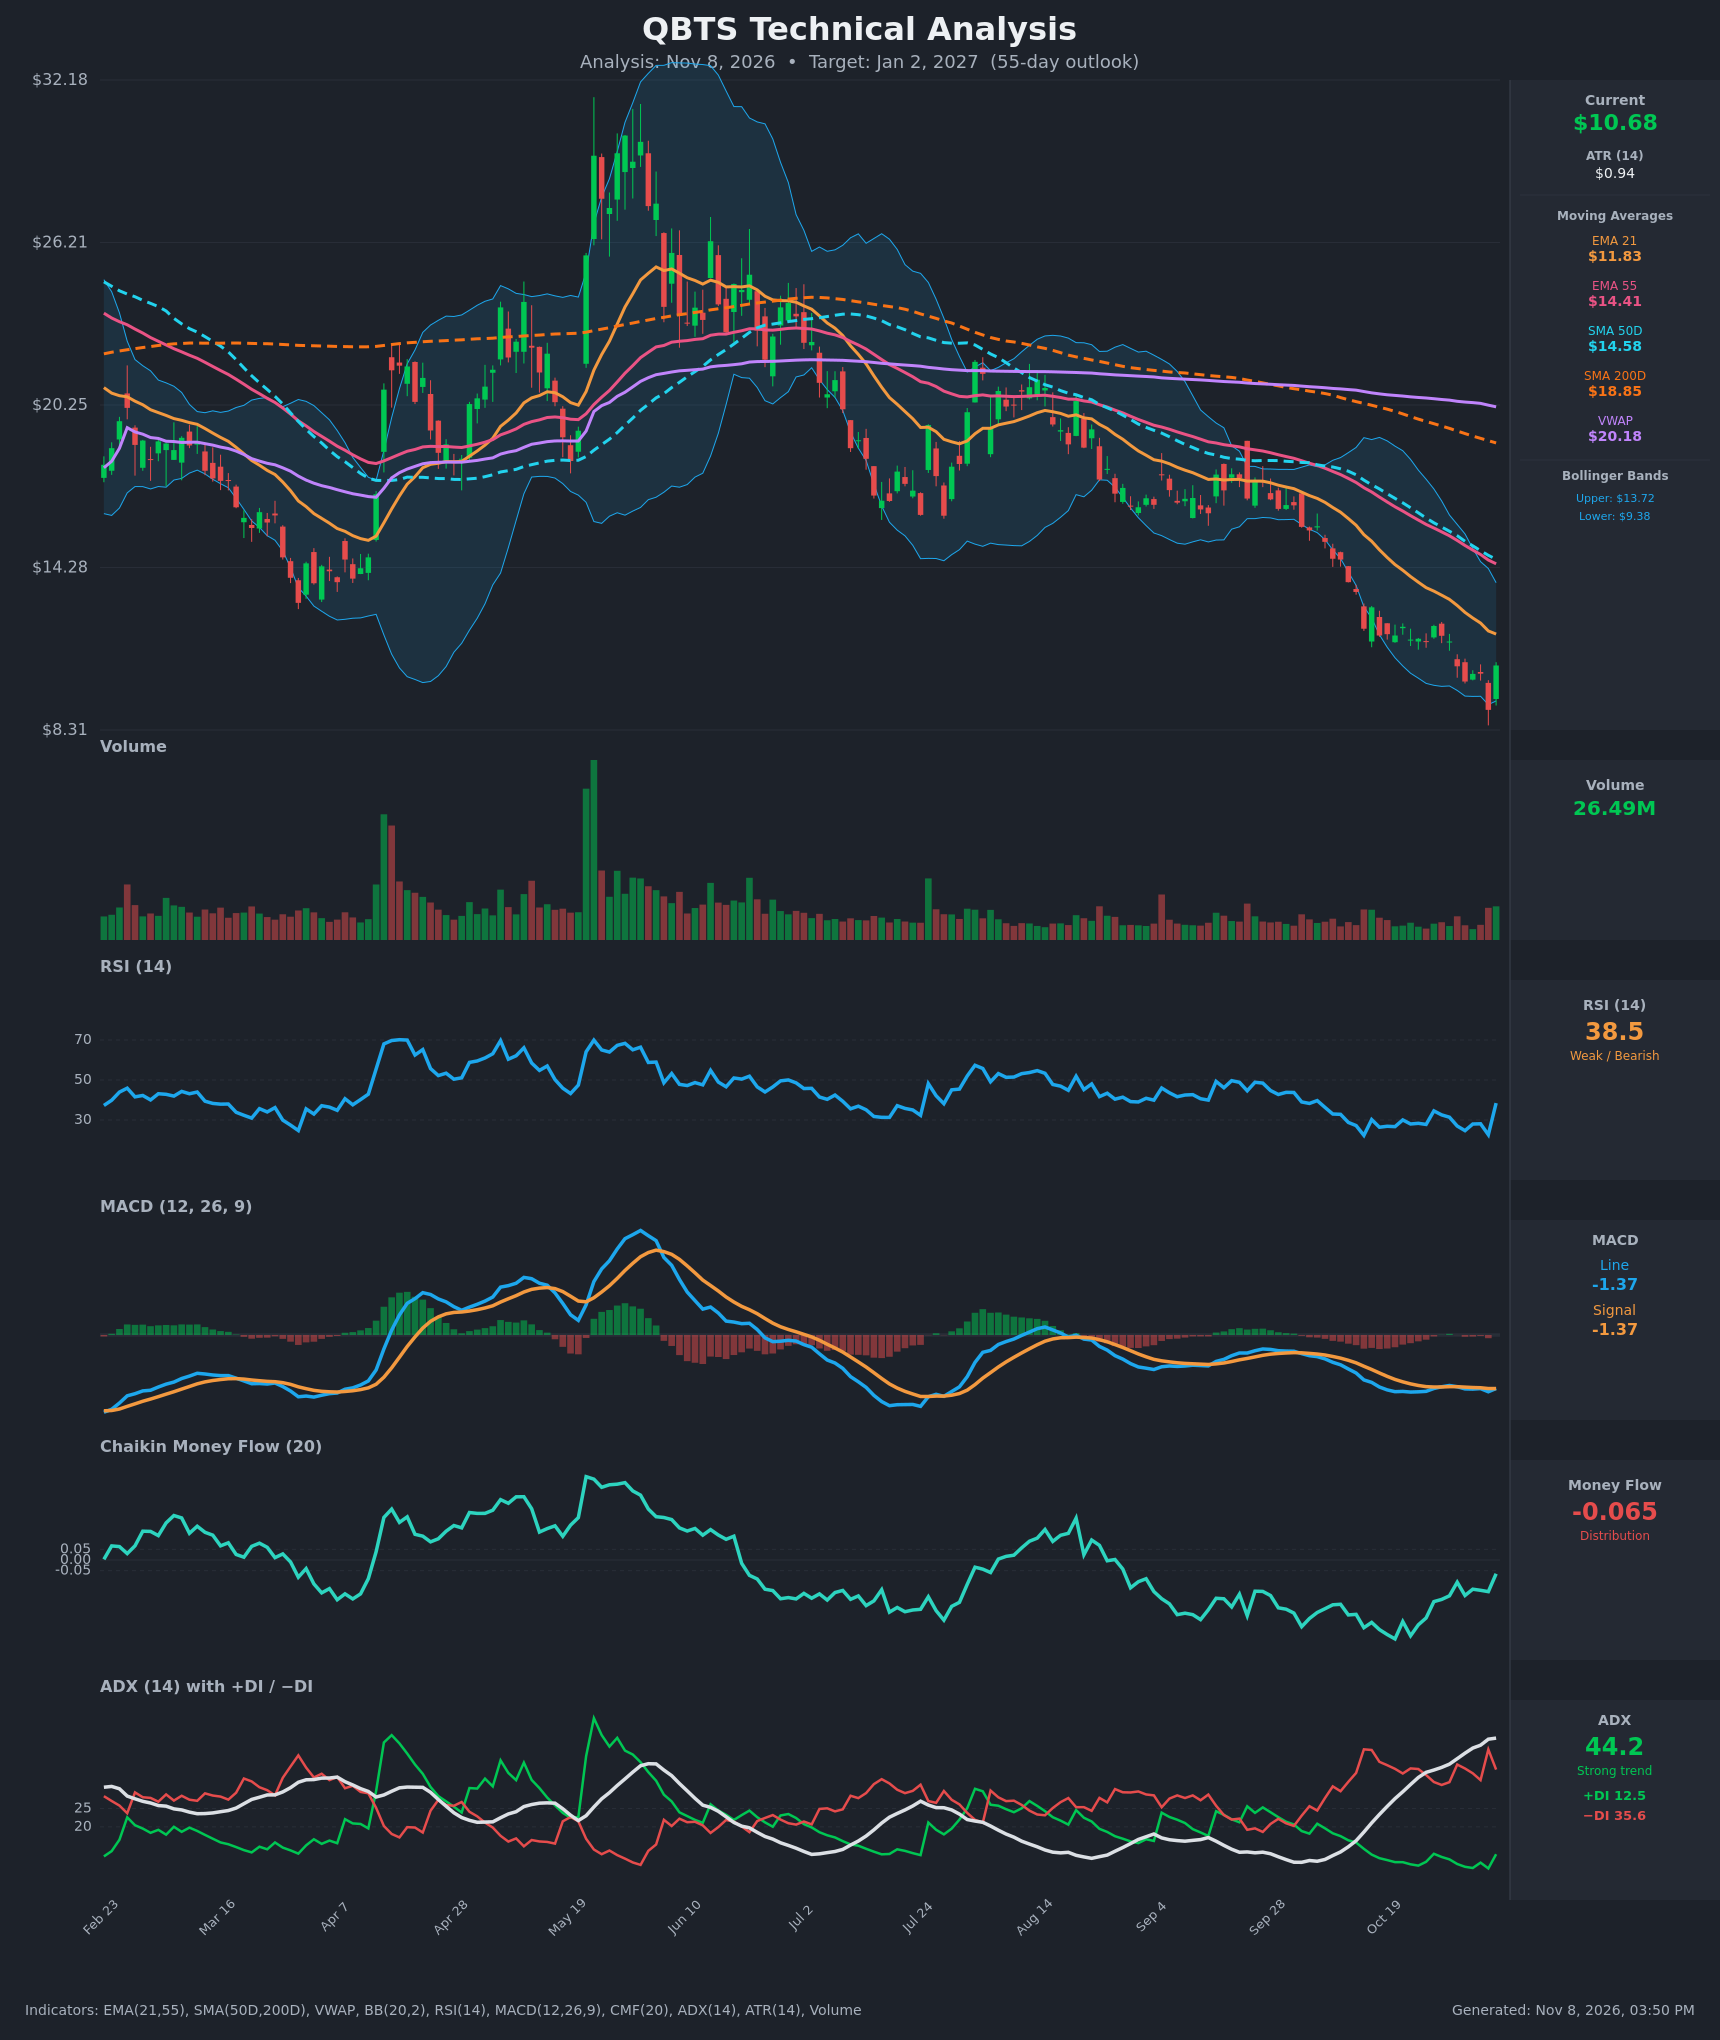
Analysis
TECHNICAL INDICATORS
- RSI (14): 38.45, bouncing sharply from 22.6 (Nov 5) but still below 40. It sits in the bearish zone, and RSI has stayed under 50 since early September. This looks like a relief bounce from oversold rather than a confirmed momentum reversal. [Bearish]
- 20 EMA (EMA 21): $11.83, above price of $10.68, so it acts as overhead resistance. It is falling steeply and sits below EMA 55 ($14.41), so the bearish EMA alignment is intact. [Bearish]
- MACD: Line -1.366 and signal -1.367 are essentially converged, so the histogram is about zero. Both lines are deeply negative. The flattening is a mild sign of selling exhaustion, but there is no positive crossover above zero, and a flat MACD at depth usually means a pause rather than a turn. [Neutral]
- Bollinger Bands (20): Upper $13.72, lower $9.38, midline about $11.55. Price pierced the lower band on Nov 5 (close $9.05) and snapped back inside to $10.68, the lower half of the bands. That is a classic oversold snap-back, with the midline (about $11.55) the first mean-reversion target. The band walk lower remains a downtrend signature. [Neutral]
- CMF (20): -0.065, just below the -0.05 threshold. It has improved from -0.37 in mid-October but has not turned positive. Selling pressure is easing, though distribution persists. [Distribution]
- ADX (14): 44.2 and still rising, with -DI (35.6) far above +DI (12.5). This is a very strong downtrend. ADX above 40 can signal a mature trend near exhaustion, but nothing indicates a reversal yet. [Strong Trend – Bearish]
- Volume: 26.49M, with the latest green bar noticeably larger than recent sessions. The bounce came on higher volume, which is a tentative sign of dip-buying. Volume is still far below the May-spike levels and has not confirmed a sustained reversal. [Neutral – relief bounce attempt]
DIVERGENCES & TRENDS
- Moving-average structure: Price ($10.68) is below EMA 21 ($11.83), EMA 55 ($14.41), SMA 50D ($14.58), SMA 200D ($18.85) and VWAP ($20.18). SMA 50D is below SMA 200D, so the death cross is already in place, and the long-term trend is firmly down.
- No bullish divergence yet: The Nov 5 low ($9.05) had an RSI of 22.6, lower than the Oct 30 and Nov 2 lows (27.0 and 24.7), so RSI confirmed the price low rather than diverging. MACD was likewise more negative.
- MACD convergence: The MACD line and signal are nearly equal after months of negative histograms. This is the earliest hint of selling pressure fading, but it is not a signal on its own.
- DI trend: -DI spiked to 41 on Nov 5 and has eased to 35.6, while +DI ticked up to 12.5. Bears still dominate by a wide margin.
- CMF trend: CMF is rising from the -0.37 trough, so there is a mild improvement in money flow. It remains negative.
- Price trend: Price has made lower highs and lower lows since the September breakdown, falling from about $18 to $9. The last bar is an +18% rebound that has not yet reclaimed EMA 21.
CHART PATTERNS
- Bearish Flag/Pennant (continuation): From Oct 19 to Nov 4 price consolidated between about $11.5 and $12.1 after a steep leg down, then broke down to $9.05. The breakdown has partly played out, and the bounce back to $10.68 resembles a retest of the broken range from below.
- Large-scale structure: The May spike to about $30 followed by a long series of lower highs forms a broad distribution top. The sequence of lower highs and lows is a persistent descending channel.
- Bullish counter-case: The sharp drop and rebound resemble the exhaustion end of a Bullish Falling Wedge, but there is no confirmed breakout above the upper trendline (about $11.8-12.1, near EMA 21), so this is only a possibility.
- Targets: Pattern-based downside points to the prior low ($9.05), then $8.31 (the chart's lowest displayed level). Upside needs a close above $11.83, then $13.72.
POTENTIAL SCENARIOS
- Scenario 1: Bearish Trend Continuation — The relief bounce fades at EMA 21 / the broken $11.5–12.1 range, and the dominant downtrend (ADX 44, -DI far above +DI) resumes. Price retests the Nov 5 low. Trigger: rejection at $11.50–$11.83, then a close below $10.00. Target: $9.05, with an extension toward $8.30. Invalidation: daily close above $12.10 with CMF turning positive. (55% probability)
- Scenario 2: Bullish Oversold Relief Rally — The Nov 5 flush to $9.05 marks a short-term low. The rally reclaims EMA 21 and mean-reverts toward the Bollinger midline and upper band. Trigger: close above $11.83 on rising volume, MACD turning positive, RSI above 50. Target: $12.80–$13.70 (upper band, converging with EMA 55 / SMA 50D). Invalidation: close below $9.05. (30% probability)
- Scenario 3: Neutral Basing Range — Price chops between $9.05 and $11.80 as selling exhausts but buyers fail to take control. Trigger: repeated failures at $11.83 with higher lows above $9.50. Target: $10–$11 midrange. Invalidation: close outside $9.05–$12.10. (15% probability)
PRICE TARGETS
Timeframe: 55 days (Jan 2, 2027). The range sits at the upper end of the 12–18% guidance because QBTS is volatile (ATR is about 8.8% of price).
- Target Price: $9.90
- Expected Range: $9.10 to $11.00 (width $1.90 = ~17.8% of current price)
- Key Levels: Support at $9.05, Resistance at $11.83
OVERALL BIAS
OVERALL BIAS: BEARISH - Price is below every moving average with a death cross in place, ADX is 44 with -DI far above +DI, and CMF remains in distribution. The bounce from oversold is unconfirmed, with EMA 21 ($11.83) as the first test, and the bearish scenario carries the most weight. Rising volume on the latest bounce and the flat MACD keep a relief rally a real risk, so conviction is moderate.
This is educational analysis and not financial advice.