RKLB 55-day bearish forecast — Nov 8, 2026
- Bias: Bearish
- Timeframe: 55 days (made Nov 8, 2026, target date Jan 1, 2027)
- Price at analysis: $53.07
- Price target: $49.00
- Expected range: $44.50 – $54.00
- Result: Pending — graded after the close on Jan 1, 2027
Get a free AI analysis of RKLB today
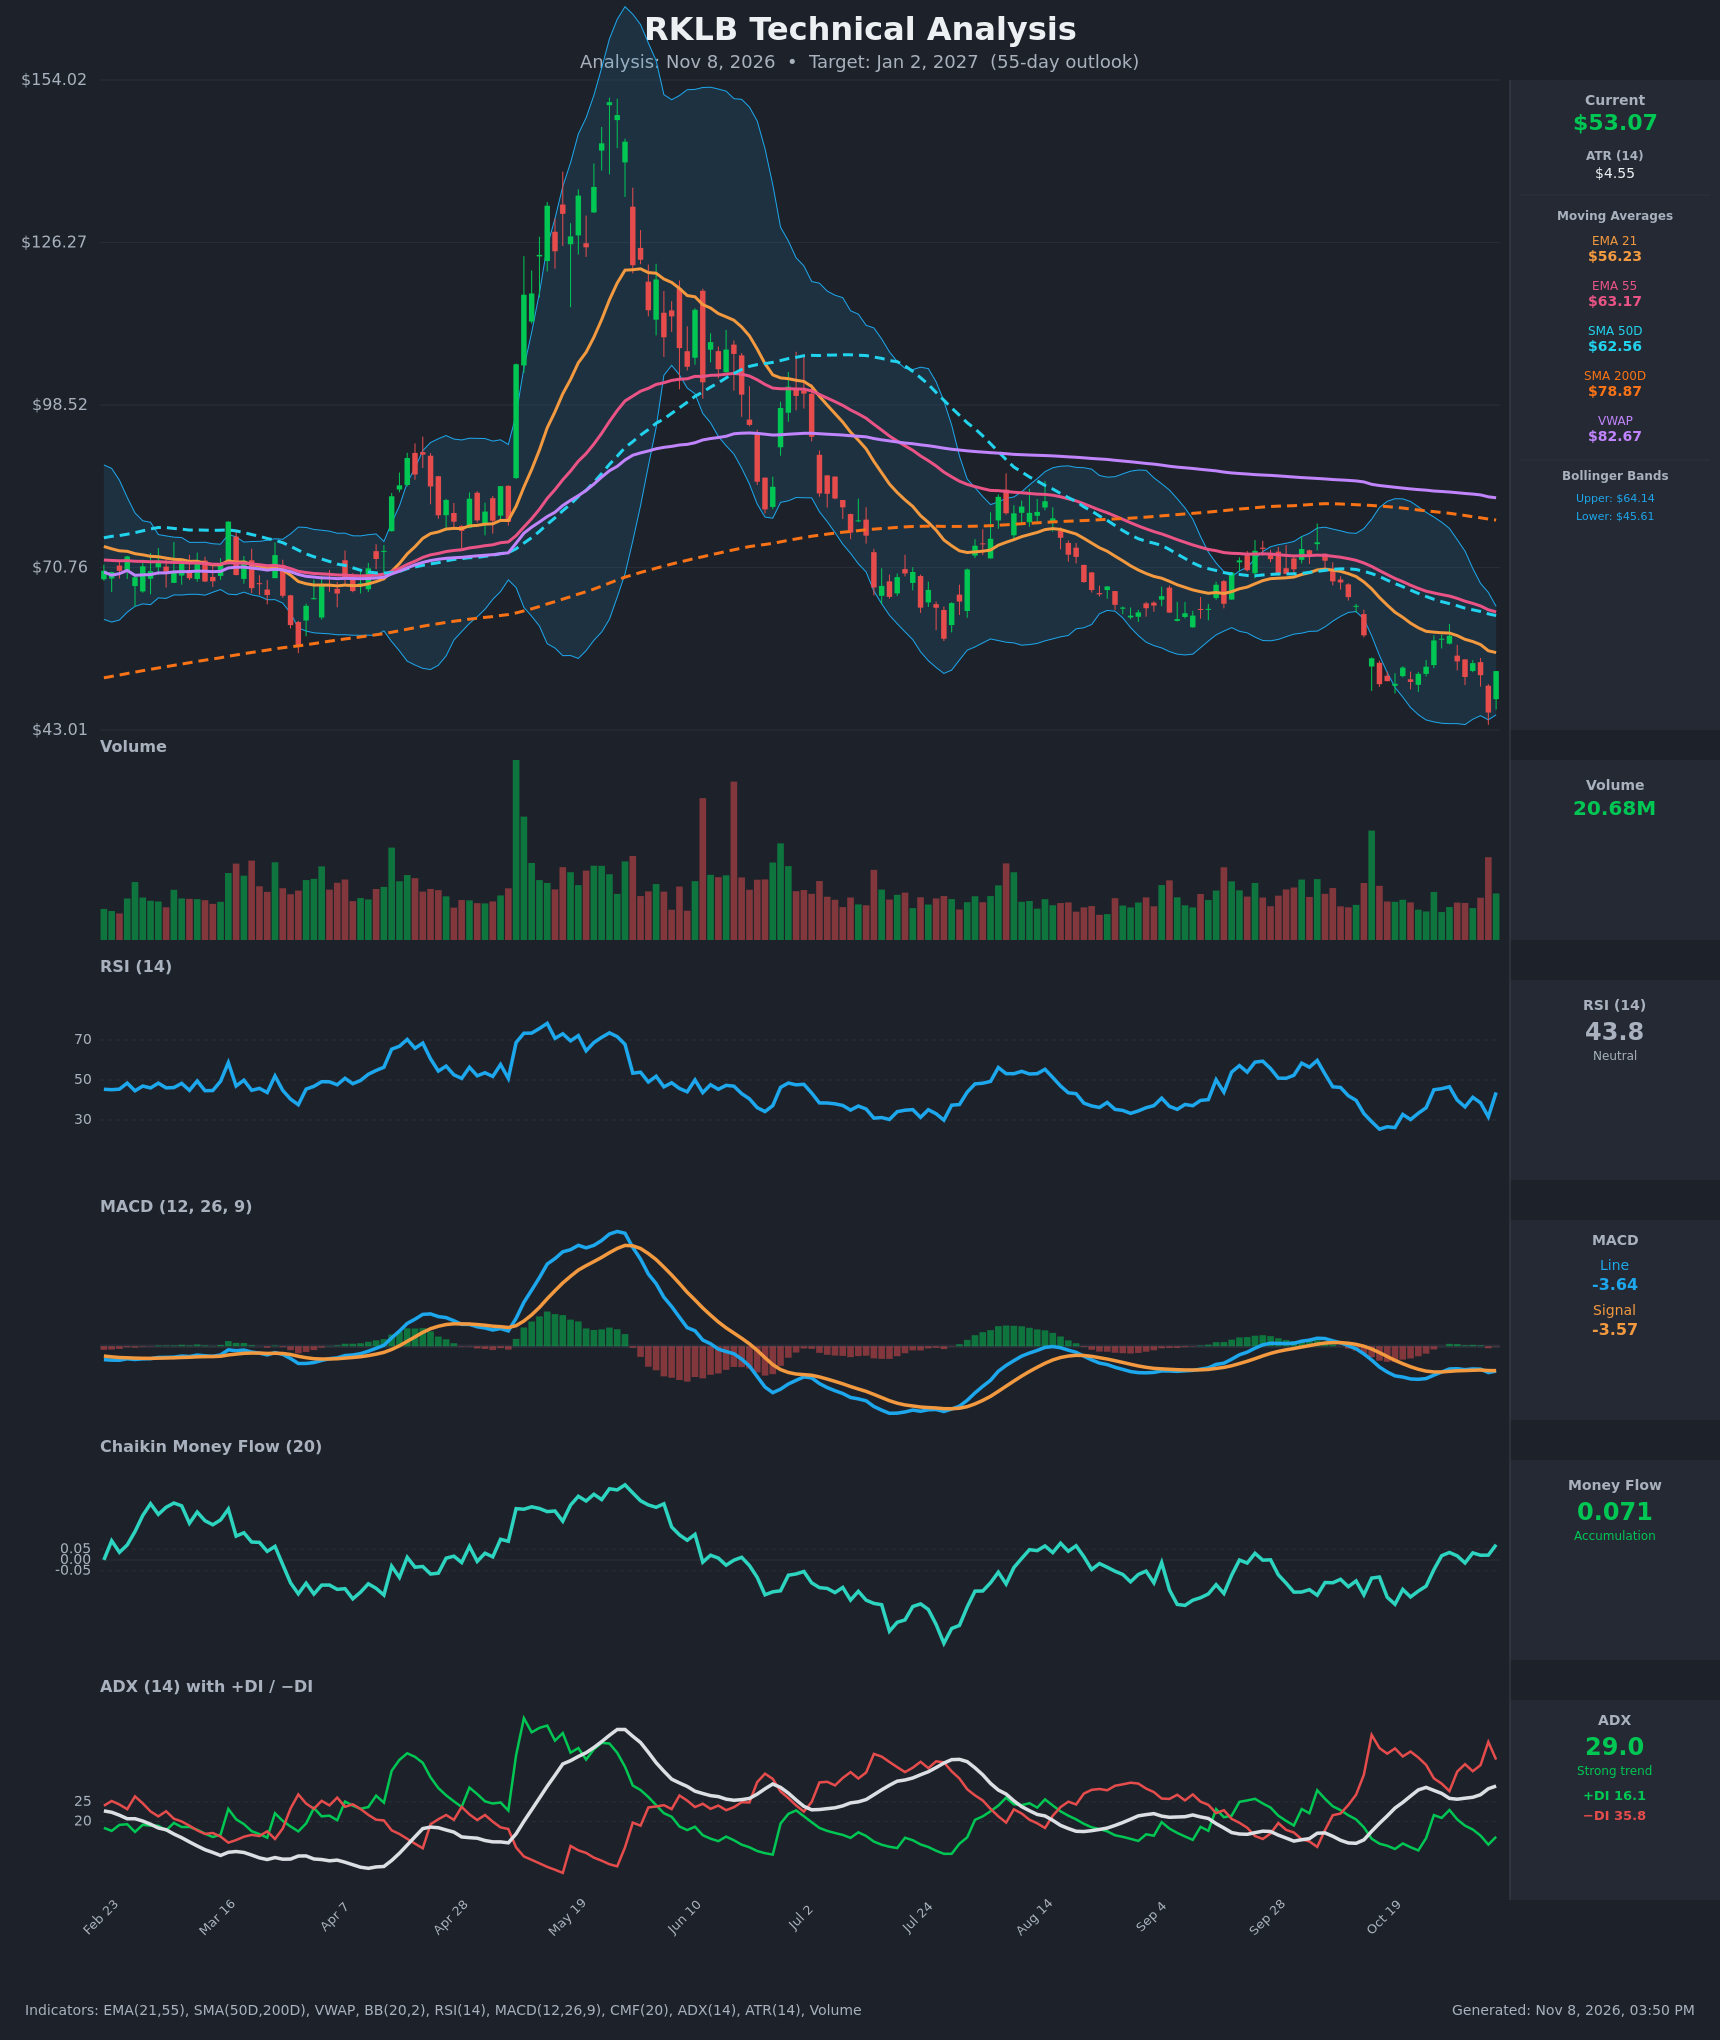
Analysis
TECHNICAL INDICATORS
- RSI (14): 43.78. It has bounced from an oversold 26.2 on Oct 20 but is still below 50 and has failed to reclaim it. It touched 31.6 on Nov 5 before Friday's snap-back. Momentum is recovering from extreme weakness, but it is not yet a trend reversal. [Neutral]
- 20 EMA: The EMA 21 is $56.23, above price at $53.07, so it acts as overhead resistance. It is also below the EMA 55 ($63.17), a bearish stack that is still widening. [Bearish]
- MACD: The line is -3.64 against a signal of -3.57, a marginally bearish configuration with a near-zero negative histogram. Both lines are deep below zero and flattening, which shows selling momentum is fading but has not turned. [Bearish]
- Bollinger Bands (20): Upper $64.14, lower $45.61, midline about $54.87. Price is just below the midline after tagging the lower band on Nov 5 ($45.99) and reversing sharply. The bands are wide, so volatility is elevated. The lower-band rejection supports a relief bounce, but price remains in the lower half of the range. [Neutral]
- CMF (20): 0.071, above the +0.05 threshold and positive for the last several sessions. It is a modest improvement from -0.2 in mid-October. This is early accumulation or dip-buying, and it is the main bullish divergence against price. [Accumulation]
- ADX (14): 29.0 and rising, with +DI 16.1 and −DI 35.8. The trend is strong and sellers are firmly in control. −DI is more than double +DI, and there is no bullish DI crossover. [Strong Trend - Bearish]
- Volume: 20.68M on the latest bar. Volume was heavy on the Nov 5 capitulation and the Nov 6 reversal bar. The high-volume bounce from the lows hints at a short-term washout, but follow-through volume is needed to confirm it. [Mixed, capitulation then bounce]
DIVERGENCES & TRENDS
- Positive divergence: CMF has turned positive (0.071) while price made a lower low at $45.99. RSI also held a higher low (31.6 on Nov 5 versus 26.2 on Oct 20) while price made a lower low. Both point to a short-term relief rally.
- Trend structure: Price is below the EMA 21 ($56.23), EMA 55 ($63.17), SMA 50D ($62.56), SMA 200D ($78.87) and VWAP ($82.67). The SMA 50D is well below the SMA 200D, so the death cross is already in place. This is a mature, entrenched downtrend.
- Crossovers: The EMA 21 has been below the EMA 55 throughout the table. MACD has hovered just under its signal with no bullish crossover. The −DI over +DI relationship is intact.
- Momentum: RSI rebounded from 26 to the low-40s, but each rally (Oct 29 high of $59.10) has been sold. Lower highs continue: $59.10 sits below earlier rally highs and below the falling EMA 21.
CHART PATTERNS
- Bearish continuation: The structure is a lower-highs, lower-lows downtrend in which a bear flag or pennant-type consolidation has formed. Price has ranged between about $46 and $59 since Oct 19. A break below $45.60 would target a measured move toward the high $30s to low $40s, and the 55-day target is a more conservative step toward that.
- Possible bullish alternative: Late-October and early-November lows ($50.90 and then $45.99) loosely resemble a Bullish Double Bottom or Falling Wedge. It is not confirmed because price has not cleared the $59 neckline and the EMA 21. Treat it as the lower-probability scenario.
- Significance: The positive CMF and RSI divergences make it a basing attempt. The dominant trend structure still favors continuation lower.
POTENTIAL SCENARIOS
- Scenario 1: Bearish Trend Continuation — Relief bounce stalls at the EMA 21 and the midline, then sellers reassert control with −DI dominant and ADX still above 25. Trigger: rejection at $56–$59, then a daily close below $50.90. Target: $45.60 retest, with a possible wick to the low $40s. Invalidation: daily close above $59.50 (the Oct 29 high). (50% probability)
- Scenario 2: Bullish Relief Rally / Basing — Positive CMF and RSI divergence, plus the Nov 5 lower-band reversal, spark a bounce that reclaims the EMA 21 and heads toward the falling EMA 55 and SMA 50D. Trigger: close above $56.23 and a MACD bullish crossover. Target: $62–$63, the SMA 50D and EMA 55 cluster. Invalidation: close below $45.60. (30% probability)
- Scenario 3: Neutral Range — Price chops between $46 and $59 as the oversold bounce and the downtrend offset each other. Trigger: repeated failures at $58–$59 and holds above $48. Target: $50–$56. Invalidation: a decisive close outside $45.60–$59.50. (20% probability)
PRICE TARGETS
- Target Price: $49.00 (55-day horizon, about 7.7% below the current price)
- Expected Range: $44.50 to $54.00 (width $9.50, about 17.9% of the current price, consistent with the 30–60 day guidance of 12–18%)
- Key Levels: Support at $45.60, Resistance at $56.23
OVERALL BIAS
OVERALL BIAS: BEARISH - Price is below every moving average with a death cross in place, and ADX of 29 with −DI (35.8) far above +DI (16.1) confirms a strong downtrend. The positive CMF and the RSI bounce argue for a relief rally, but the evidence favors a rejection near the EMA 21 and a drift back toward the $45–$49 area.
This is educational analysis and not financial advice.