SOFI 55-day bearish forecast — Nov 8, 2026
- Bias: Bearish
- Timeframe: 55 days (made Nov 8, 2026, target date Jan 1, 2027)
- Price at analysis: $16.21
- Price target: $15.30
- Expected range: $14.00 – $16.85
- Result: Pending — graded after the close on Jan 1, 2027
Get a free AI analysis of SOFI today
Analysis
TECHNICAL INDICATORS
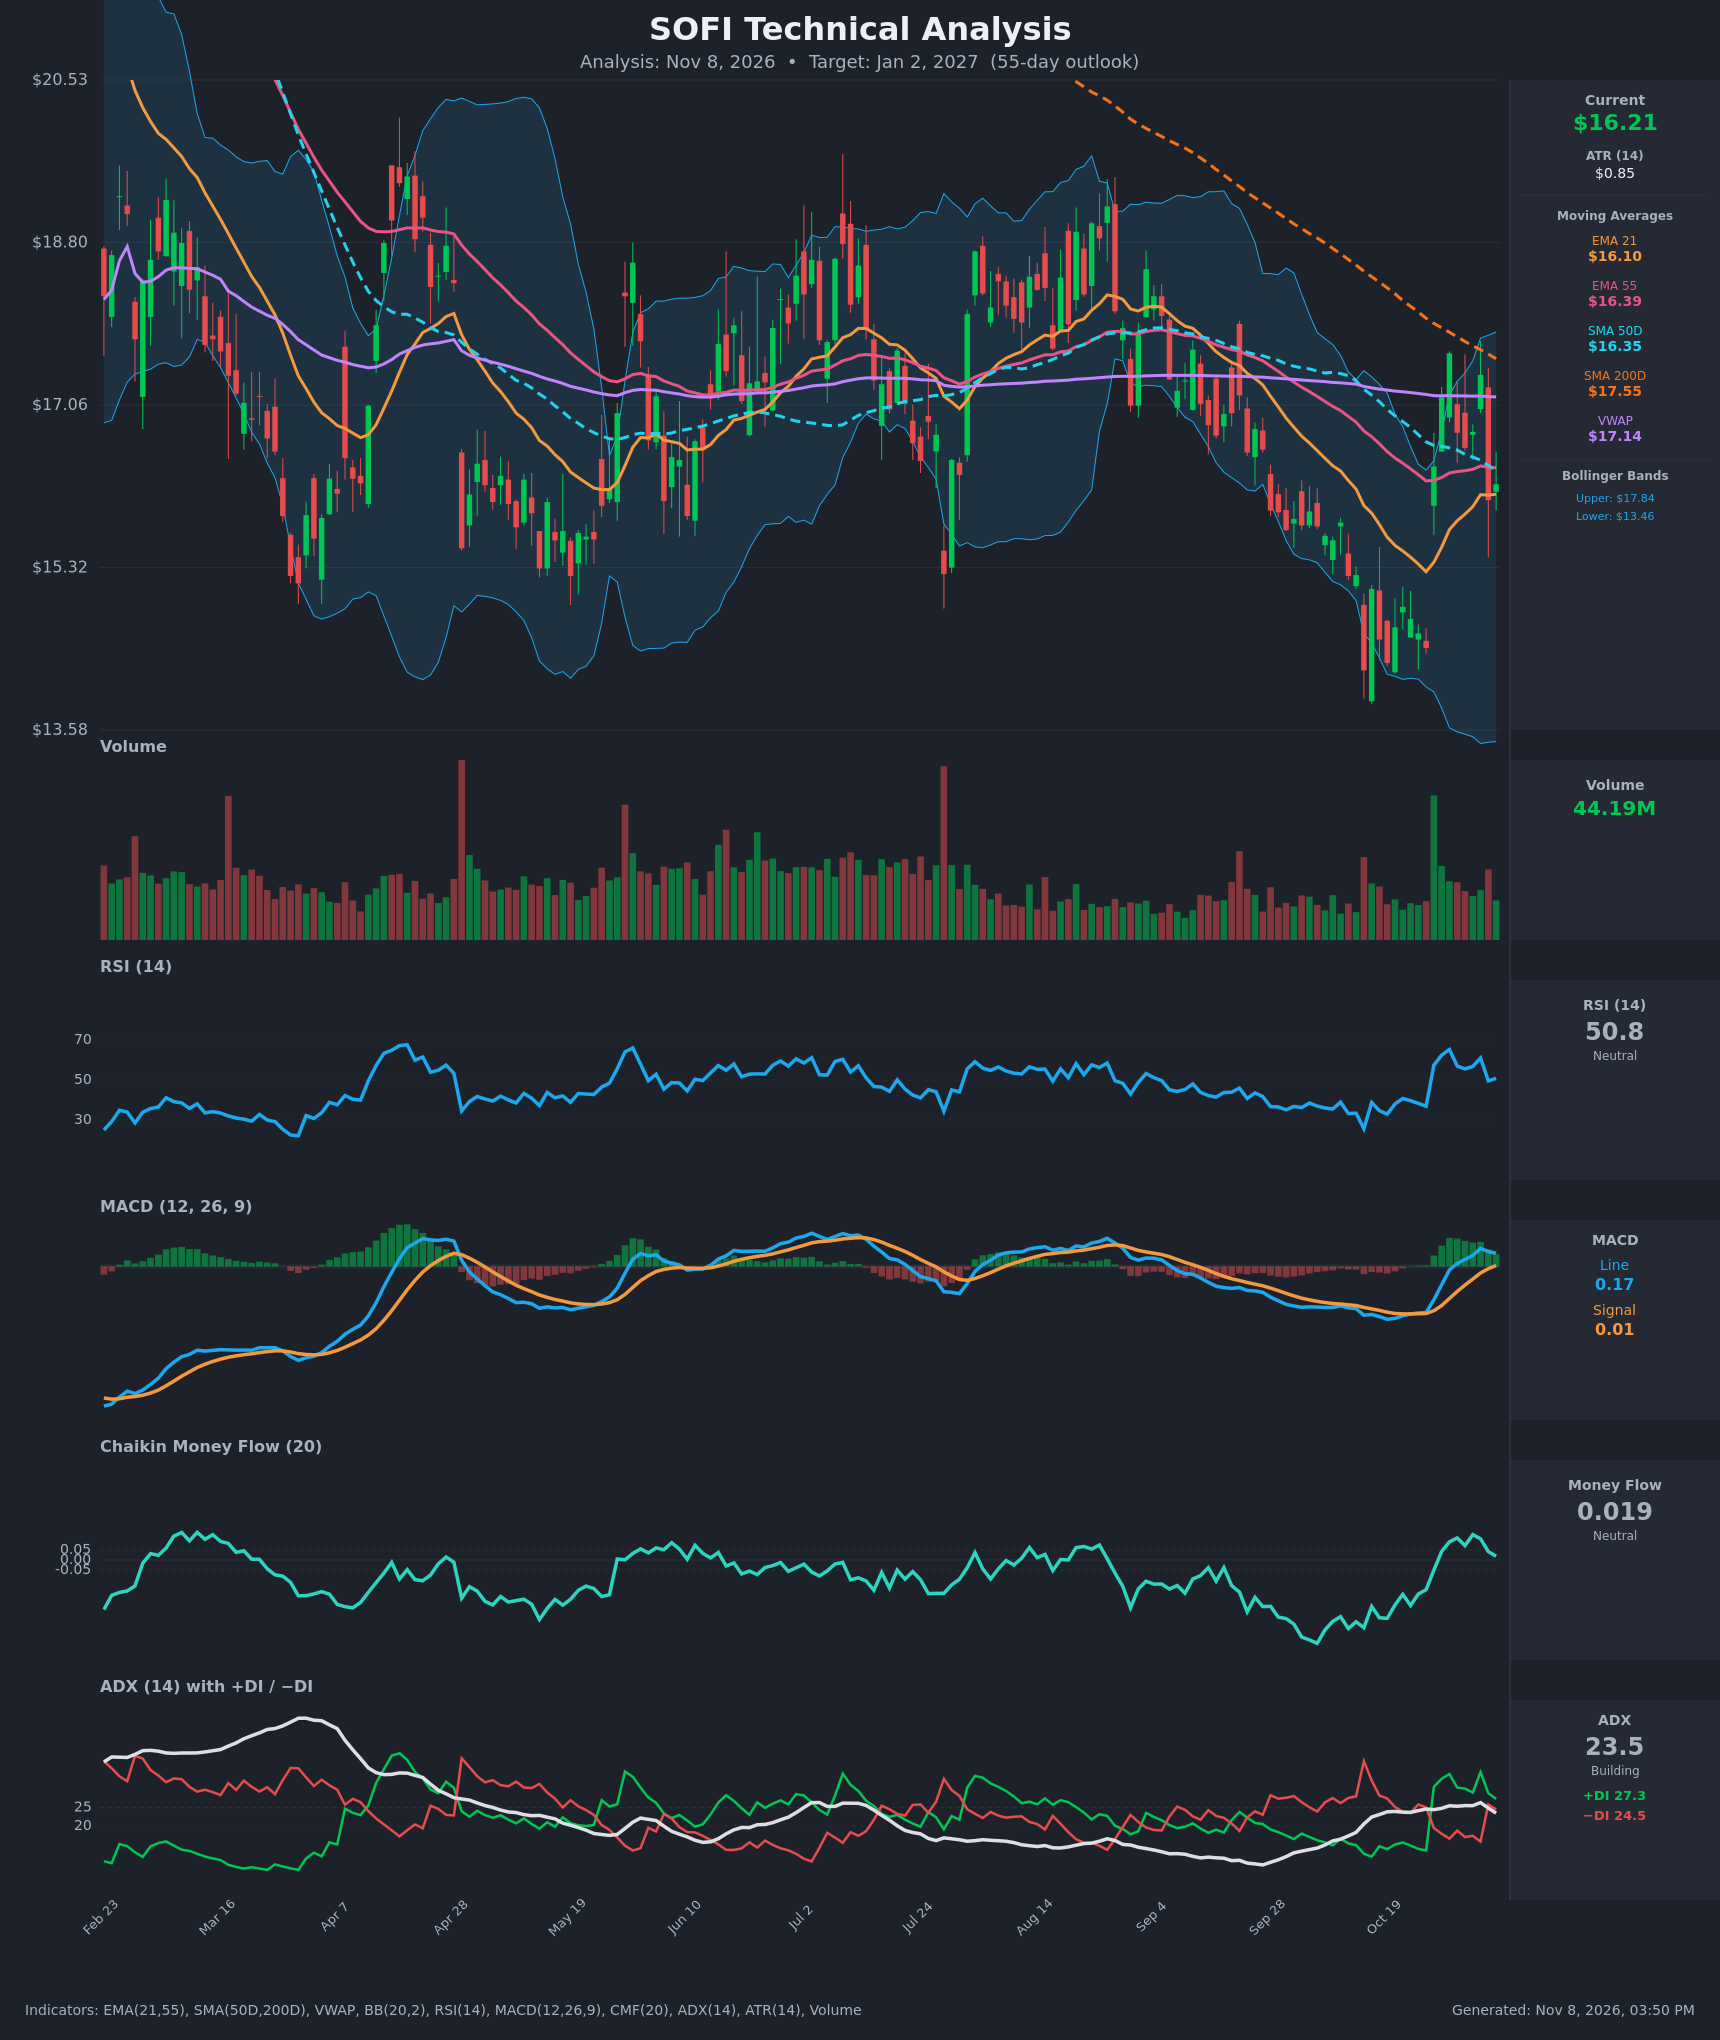
- RSI (14): 50.83, mid-range. It spiked to about 65 on Oct 29 and again to 61 on Nov 4, then rolled over to about 50 after the Nov 5 drop. Momentum has faded from the bounce highs and failed to break above 65-70. [Neutral]
- 20 EMA (EMA 21): $16.10. Price ($16.21) is just above it, but the EMA is flat-to-rising only because of the sharp bounce off $13.9. It is the first support, and a close below it would hand control back to sellers. [Neutral]
- MACD: The line (0.172) is above the signal (0.011) after a bullish crossover on Oct 30. The line peaked at 0.232 on Nov 4 and is now falling, and the histogram has shrunk from about +0.32 to +0.16. The cross is real but momentum is decelerating. [Neutral]
- Bollinger Bands (20): Upper $17.84, lower $13.46, so the bands are wide after the volatile selloff and rebound. Price sits just above the midline (about $15.65), and the rebound stalled well below the upper band at the $17.38 high. The wide bands imply high volatility and no squeeze. [Neutral]
- CMF (20): 0.019, inside the ±0.05 neutral band. It rose from -0.29 to a peak of 0.126 and is now fading back toward zero, so the accumulation burst is already fading. [Neutral]
- ADX (14): 23.5 with +DI 27.3 and −DI 24.5. The trend is moderate and ADX is slipping from 26.3. The +DI/−DI gap has narrowed sharply from 34.6/15.8 on Nov 4, so bulls are barely in control and the spread could flip soon. [Weak Trend, slight bullish lean fading]
- Volume: 44.19M on the latest bar. The largest volume of the recent window was on the Oct 27 rebound candle, while the Nov 5 red candle came on elevated volume too. Volume has not confirmed a sustained breakout, and the reversal candle on Nov 5 shows sellers active near $17.4. [Mixed, bearish rejection on volume]
DIVERGENCES & TRENDS
- Long-term structure: Price ($16.21) is below the SMA200D ($17.55) and VWAP ($17.14). The SMA50D ($16.35) is well below the SMA200D, so a death cross is already in place. The SMA200D is still falling (about $18.3 to $17.55 in three weeks), and the dashed SMA200 line on the chart slopes steadily down.
- Lower highs: The chart shows a sequence of lower swing highs (roughly $20+ early in the year, then about $19, about $18.5, and now $17.6/$17.4). This is a classic downtrend structure.
- Moving-average cluster: Price is chopping between EMA21 ($16.10) and EMA55 ($16.39), and the SMA50D ($16.35) sits in the same band. This is a decision zone. EMA21 is still below EMA55, so there is no bullish EMA cross yet.
- Momentum: The MACD bullish crossover happened from deeply negative territory and is already losing steam. RSI failed below 65, and CMF and +DI are fading. No clean price/indicator divergence, but momentum is rolling over from a lower-high rebound.
- Rejection candle: Nov 5 dropped from $17.38 to $16.04 (about -7.7%) with +DI collapsing and −DI jumping from 15.8 to 25.8. That is a sharp bearish reversal at the underside of the SMA200D/VWAP resistance zone.
CHART PATTERNS
- Bearish Flag/Pennant (continuation): After the decline from about $17.5 to $13.9, the V-shaped bounce into the $17.4 area that stalled under the SMA200D resembles a corrective retracement within a larger downtrend. A decisive break below $15.9 would resume the decline toward $14.5-$15.0.
- Descending/lower-high structure: The overall trend since early in the year shows a descending channel with the SMA200D acting as a ceiling. This is consistent with a Descending Triangle bias, with support near $13.9.
- Bullish counterpoint: The $13.9 low could be a base, but only one low has formed, so there is no valid Double Bottom. A bullish case needs a close above $17.55 (SMA200D) to count as a trend change.
- Target logic: A measured move of about 1 ATR-based swing plus the flag implies roughly $14.5-$15.3. A full retest of $13.9 is the extreme scenario.
POTENTIAL SCENARIOS
- Scenario 1: Bearish Lower-High Rejection — Price fails again under the VWAP/SMA200D zone and rolls over from the EMA cluster. MACD histogram turns negative and −DI retakes the lead. Trigger: daily close below $15.90 (below EMA21 and the Nov 5 low). Target: $15.30 first, then $14.30-$14.60. Invalidation: daily close above $17.55. (50% probability)
- Scenario 2: Bullish Breakout Above Resistance — The October low holds as a base and buyers push through VWAP and the SMA200D. The MACD crossover and +DI strength carry the move. Trigger: close above $17.40-$17.55 on strong volume. Target: $18.80. Invalidation: close back below $16.00. (28% probability)
- Scenario 3: Neutral Range Chop — Price oscillates between $15.30 and $17.00 around the flat-to-converging moving average cluster, with ADX staying below 25. Trigger: ADX falling toward 20 and a stalling MACD. Target: $16.00-$16.60. Invalidation: close outside $15.30-$17.40. (22% probability)
PRICE TARGETS
- Target Price: $15.30 (55-day horizon, about -5.6% from current)
- Expected Range: $14.00 to $16.85 (width $2.85, about 17.6% of the current price, consistent with the 30-60 day guidance of 12-18%)
- Key Levels: Support at $14.30 (late-October swing lows), Resistance at $17.14 (VWAP, with the SMA200D at $17.55 just above)
OVERALL BIAS
OVERALL BIAS: BEARISH - Price remains below the falling SMA200D and VWAP, the bounce made another lower high at $17.38 and reversed sharply on Nov 5, and momentum (MACD histogram, RSI, CMF, +DI) is fading. The MACD cross is the main bullish offset, so conviction is modest.
This is educational analysis and not financial advice.