SOXL 55-day bullish forecast — Nov 8, 2026
- Bias: Bullish
- Timeframe: 55 days (made Nov 8, 2026, target date Jan 1, 2027)
- Price at analysis: $45.97
- Price target: $48.00
- Expected range: $43.00 – $51.25
- Result: Pending — graded after the close on Jan 1, 2027
Get a free AI analysis of SOXL today
Analysis
TECHNICAL INDICATORS
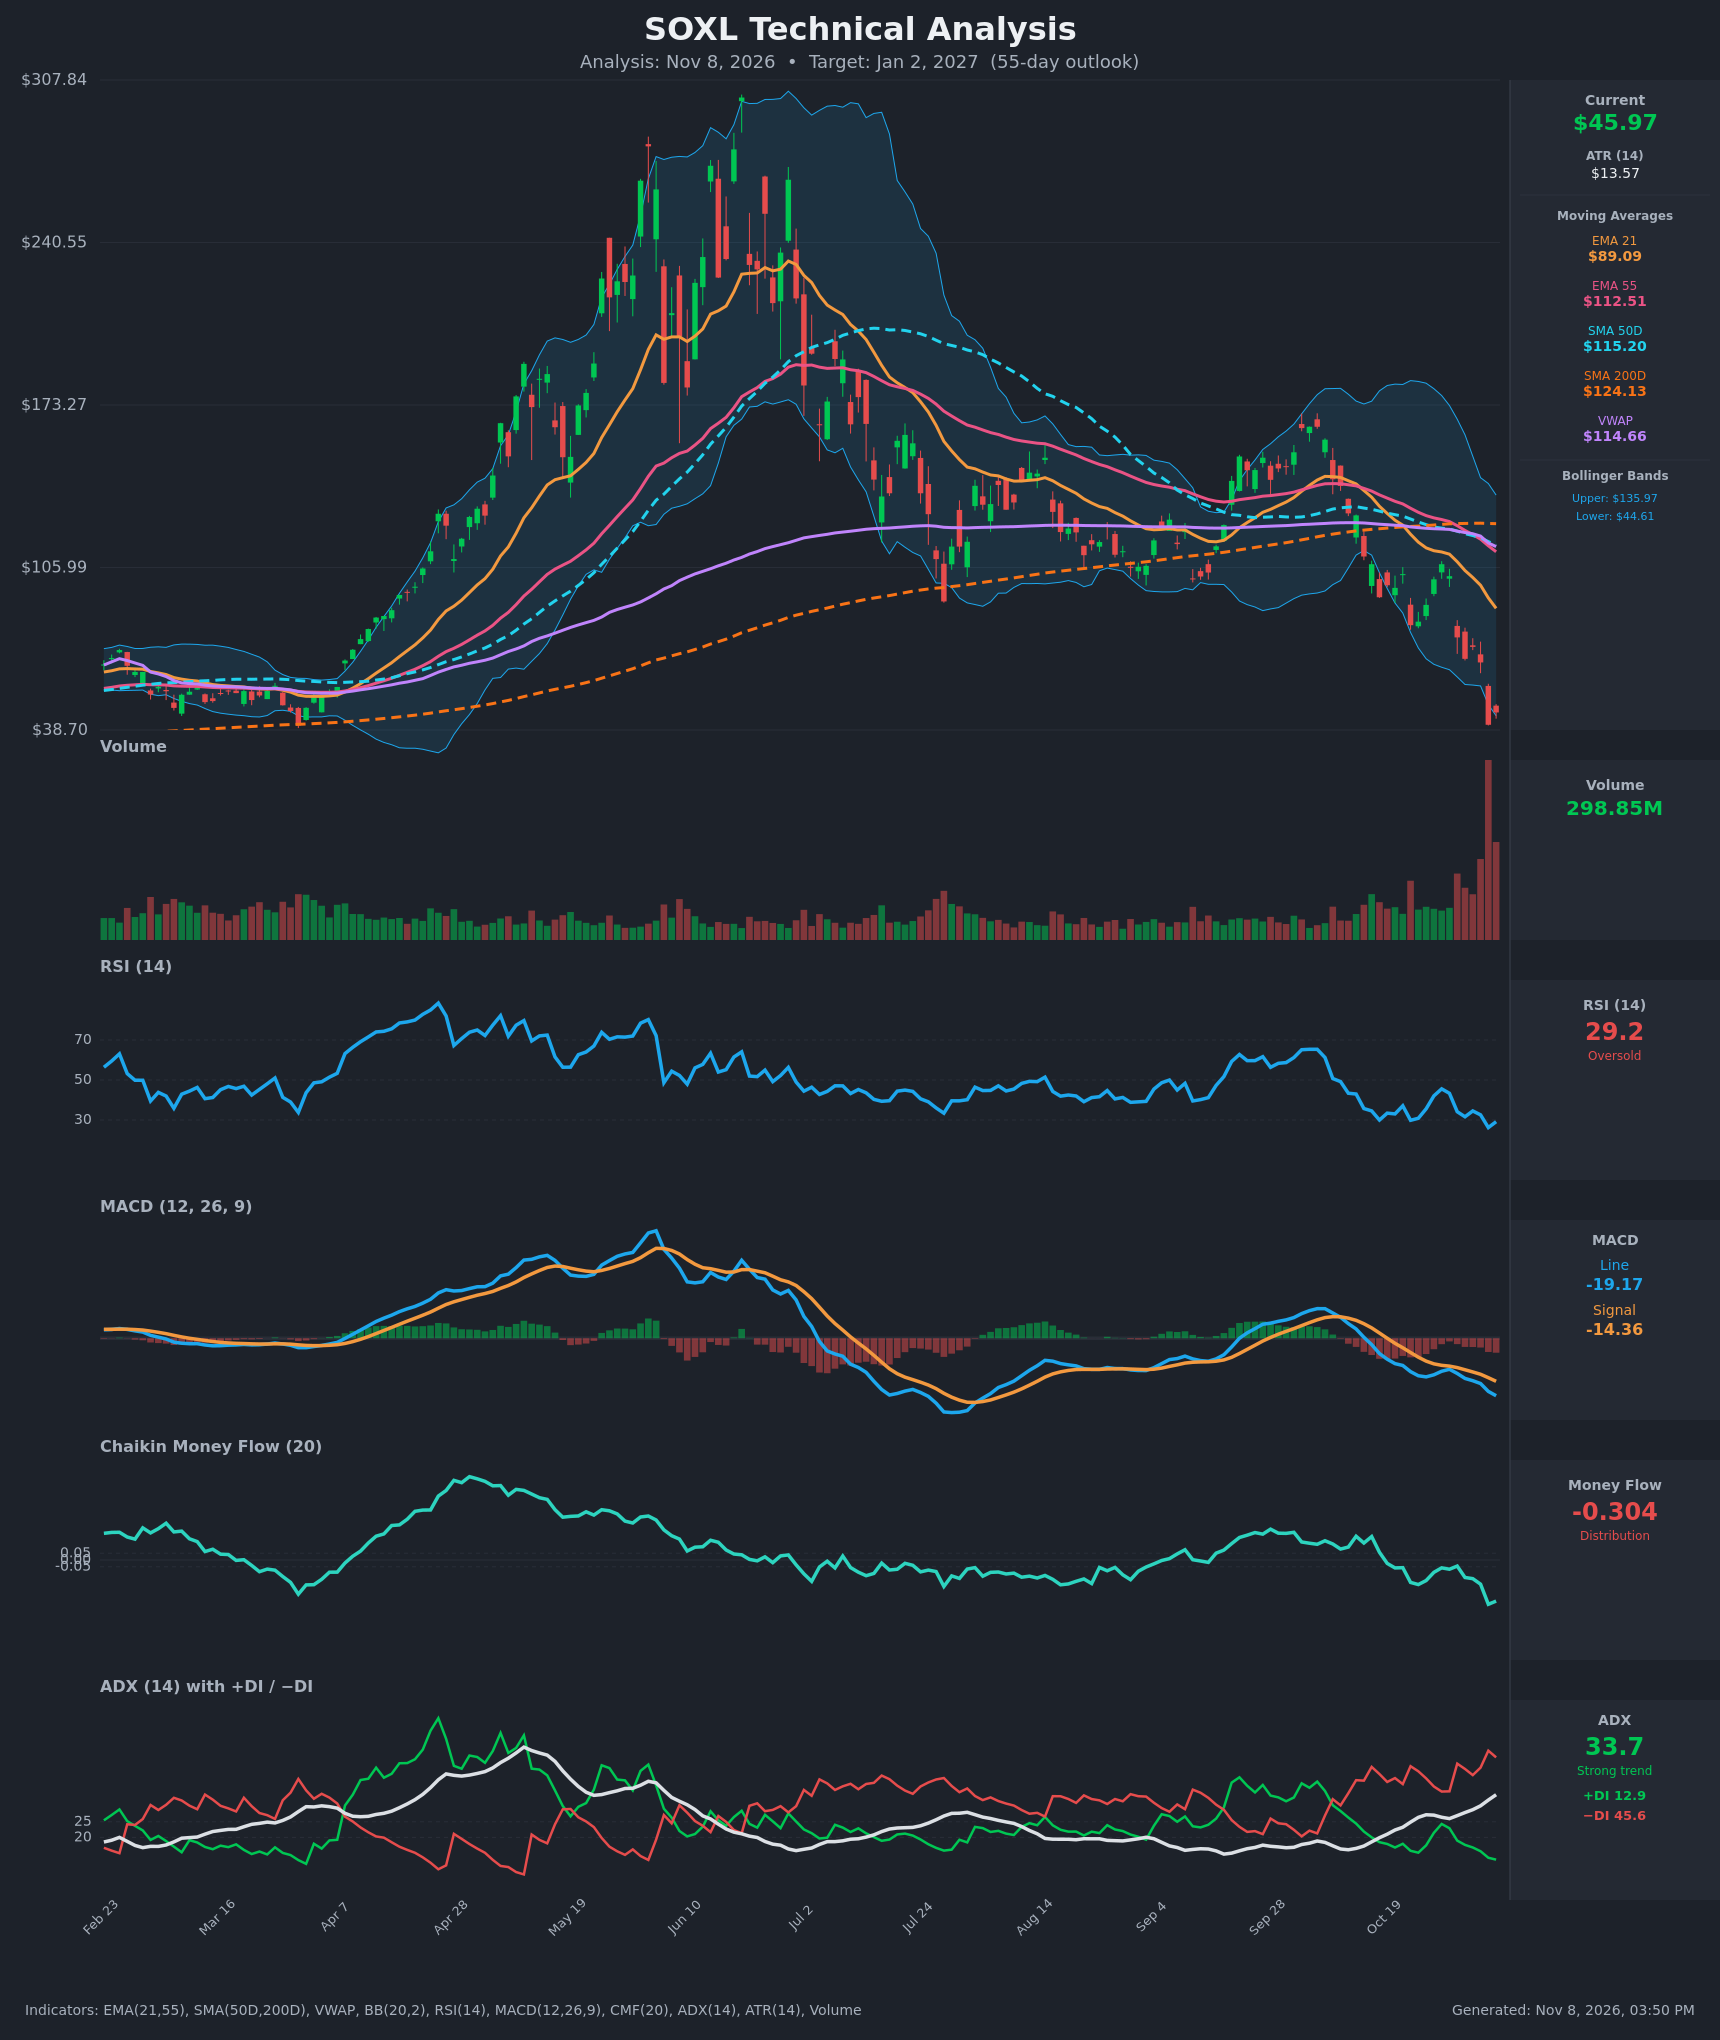
- RSI (14): 29.16, back in oversold territory after printing 26.2 on Nov 5. It has fallen from 45.6 on Oct 28 and is only just ticking up from the extreme low. Oversold readings in a strong downtrend can persist, but this is a stretched condition that favors a relief bounce. [Neutral]
- 20 EMA: The 21 EMA is $89.09, about 94% above the $45.97 price. It is falling fast (from $128 on Oct 19) and sits below the 55 EMA ($112.51), a bearish alignment. It is far overhead and acts as distant resistance. [Bearish]
- MACD: The line is -19.17 against a signal of -14.36, so the histogram is about -4.8. The gap has widened every day for the last 15 bars, with no bullish crossover. Momentum is still deteriorating. [Bearish]
- Bollinger Bands (20): The upper band is $135.97 and the lower is $44.61. Price at $45.97 sits right on the lower band after riding it down, and the bands are very wide, which signals extreme volatility. This is stretched and prone to a snap-back, but it is also a classic "band walk" in a downtrend. [Neutral]
- CMF (20): -0.304, the lowest reading on the chart and far below -0.05. It is falling sharply from -0.06 on Oct 20, which shows heavy, accelerating distribution. [Distribution]
- ADX (14): 33.7 and rising, with −DI (45.6) far above +DI (12.9). This is a strong, well-established downtrend with bears firmly in control. [Strong Trend – Bearish]
- Volume: 298.85M, with the Nov 5 capitulation bar the largest on the chart by far. A -38% day on that volume looks like a washout or climactic selloff. That often marks a tradable low, though not a confirmed one. [Capitulation / Heavy Selling]
DIVERGENCES & TRENDS
- Price vs. RSI: There is no clean bullish divergence yet. Price made a new low ($40.87) on Nov 5 with RSI at 26.2, and the Nov 6 bounce to $45.97 lifted RSI only to 29.2. The Aug–Oct lows had RSI around 30–33, so momentum is now more depressed than at prior lows.
- MACD: The line and signal are both deeply negative and still diverging. Momentum is not bottoming yet.
- Moving-average structure: A death cross occurred on Oct 27, when the SMA50D ($122.73) crossed below the SMA200D ($123.58). The SMA50D is now $115.20 against the SMA200D at $124.13. The EMA21 is below the EMA55, and price is far below every average and below VWAP ($114.66). The long-term trend is firmly down.
- Trend/DI: −DI has dominated +DI since late September, and ADX is rising from the low 20s to 33.7. The trend is strengthening, not exhausting.
- Exhaustion clues: A record-volume capitulation bar, RSI at 26–29, price at the lower Bollinger Band, and CMF at an extreme low all point to selling exhaustion on a short-term basis, even though the trend indicators remain bearish.
CHART PATTERNS
- Broken range / bearish continuation: Price spent August–October in a roughly $105–$170 consolidation. It broke down below that range and the 200-day average with a sharp measured leg lower. This resembles a bearish continuation breakdown (similar to a descending triangle or rising-wedge resolution), and the parabolic move from $307 to $40 shows a large-scale reversal.
- Capitulation low: The Nov 5 spike low at $40.87 on record volume is a potential base. It is not a confirmed bullish reversal pattern from the diagram, such as a double bottom or falling wedge. A bullish double bottom would only be confirmed by a retest of about $41 holding and a break above the Nov 3 level near $73.
- Targets: The nearest relief targets are the lower band and EMA zone near $52–$57, then the Nov 4 close and gap area near $66.68. On the downside, a break of $40.87 opens the way to new lows in the mid-to-high $30s.
POTENTIAL SCENARIOS
- Scenario 1: Bullish Capitulation Relief Bounce — The record-volume washout and oversold RSI lead to a dead-cat or relief rally that stalls well below the falling EMA21 ($89). Trigger: a daily close above $50 with RSI back above 35. Target: $52–$57. Invalidation: a daily close below $40.87. (45% probability)
- Scenario 2: Bearish Trend Continuation — Strong −DI, a widening MACD gap and persistent distribution (CMF -0.30) keep price falling, with the bounce failing at the $50–$55 area. Trigger: a break below $40.87 on rising volume. Target: $34–$38. Invalidation: a close above $57. (40% probability)
- Scenario 3: Neutral Base-Building Chop — Price consolidates between the capitulation low and the first resistance as volatility cools. Trigger: several sessions of narrowing ranges between $41 and $52 with falling volume. Target: $44–$50. Invalidation: a close outside $40.87–$55. (15% probability)
PRICE TARGETS
- Target Price: $48.00 (55-day horizon, about +4.4% from $45.97)
- Expected Range: $43.00 to $51.25 (width $8.25, about 18% of the current price, the top of the 12–18% guidance for 30–60 days; realized volatility, ATR $13.57, is far higher, so tails beyond this range are a real risk)
- Key Levels: Support at $40.87, Resistance at $66.68
OVERALL BIAS
OVERALL BIAS: BULLISH - The record-volume capitulation, RSI near 29, price at the lower Bollinger Band and extreme negative CMF favor a modest relief bounce within a still-bearish larger trend. Conviction is modest: ADX 33.7 with −DI dominant, a death cross and widening MACD mean any rally likely faces heavy resistance, and a break below $40.87 invalidates the call.
This is educational analysis and not financial advice.