XLF 55-day bullish forecast — Nov 8, 2026
- Bias: Bullish
- Timeframe: 55 days (made Nov 8, 2026, target date Jan 1, 2027)
- Price at analysis: $57.16
- Price target: $58.40
- Expected range: $52.60 – $61.50
- Result: Pending — graded after the close on Jan 1, 2027
Get a free AI analysis of XLF today
Analysis
TECHNICAL INDICATORS
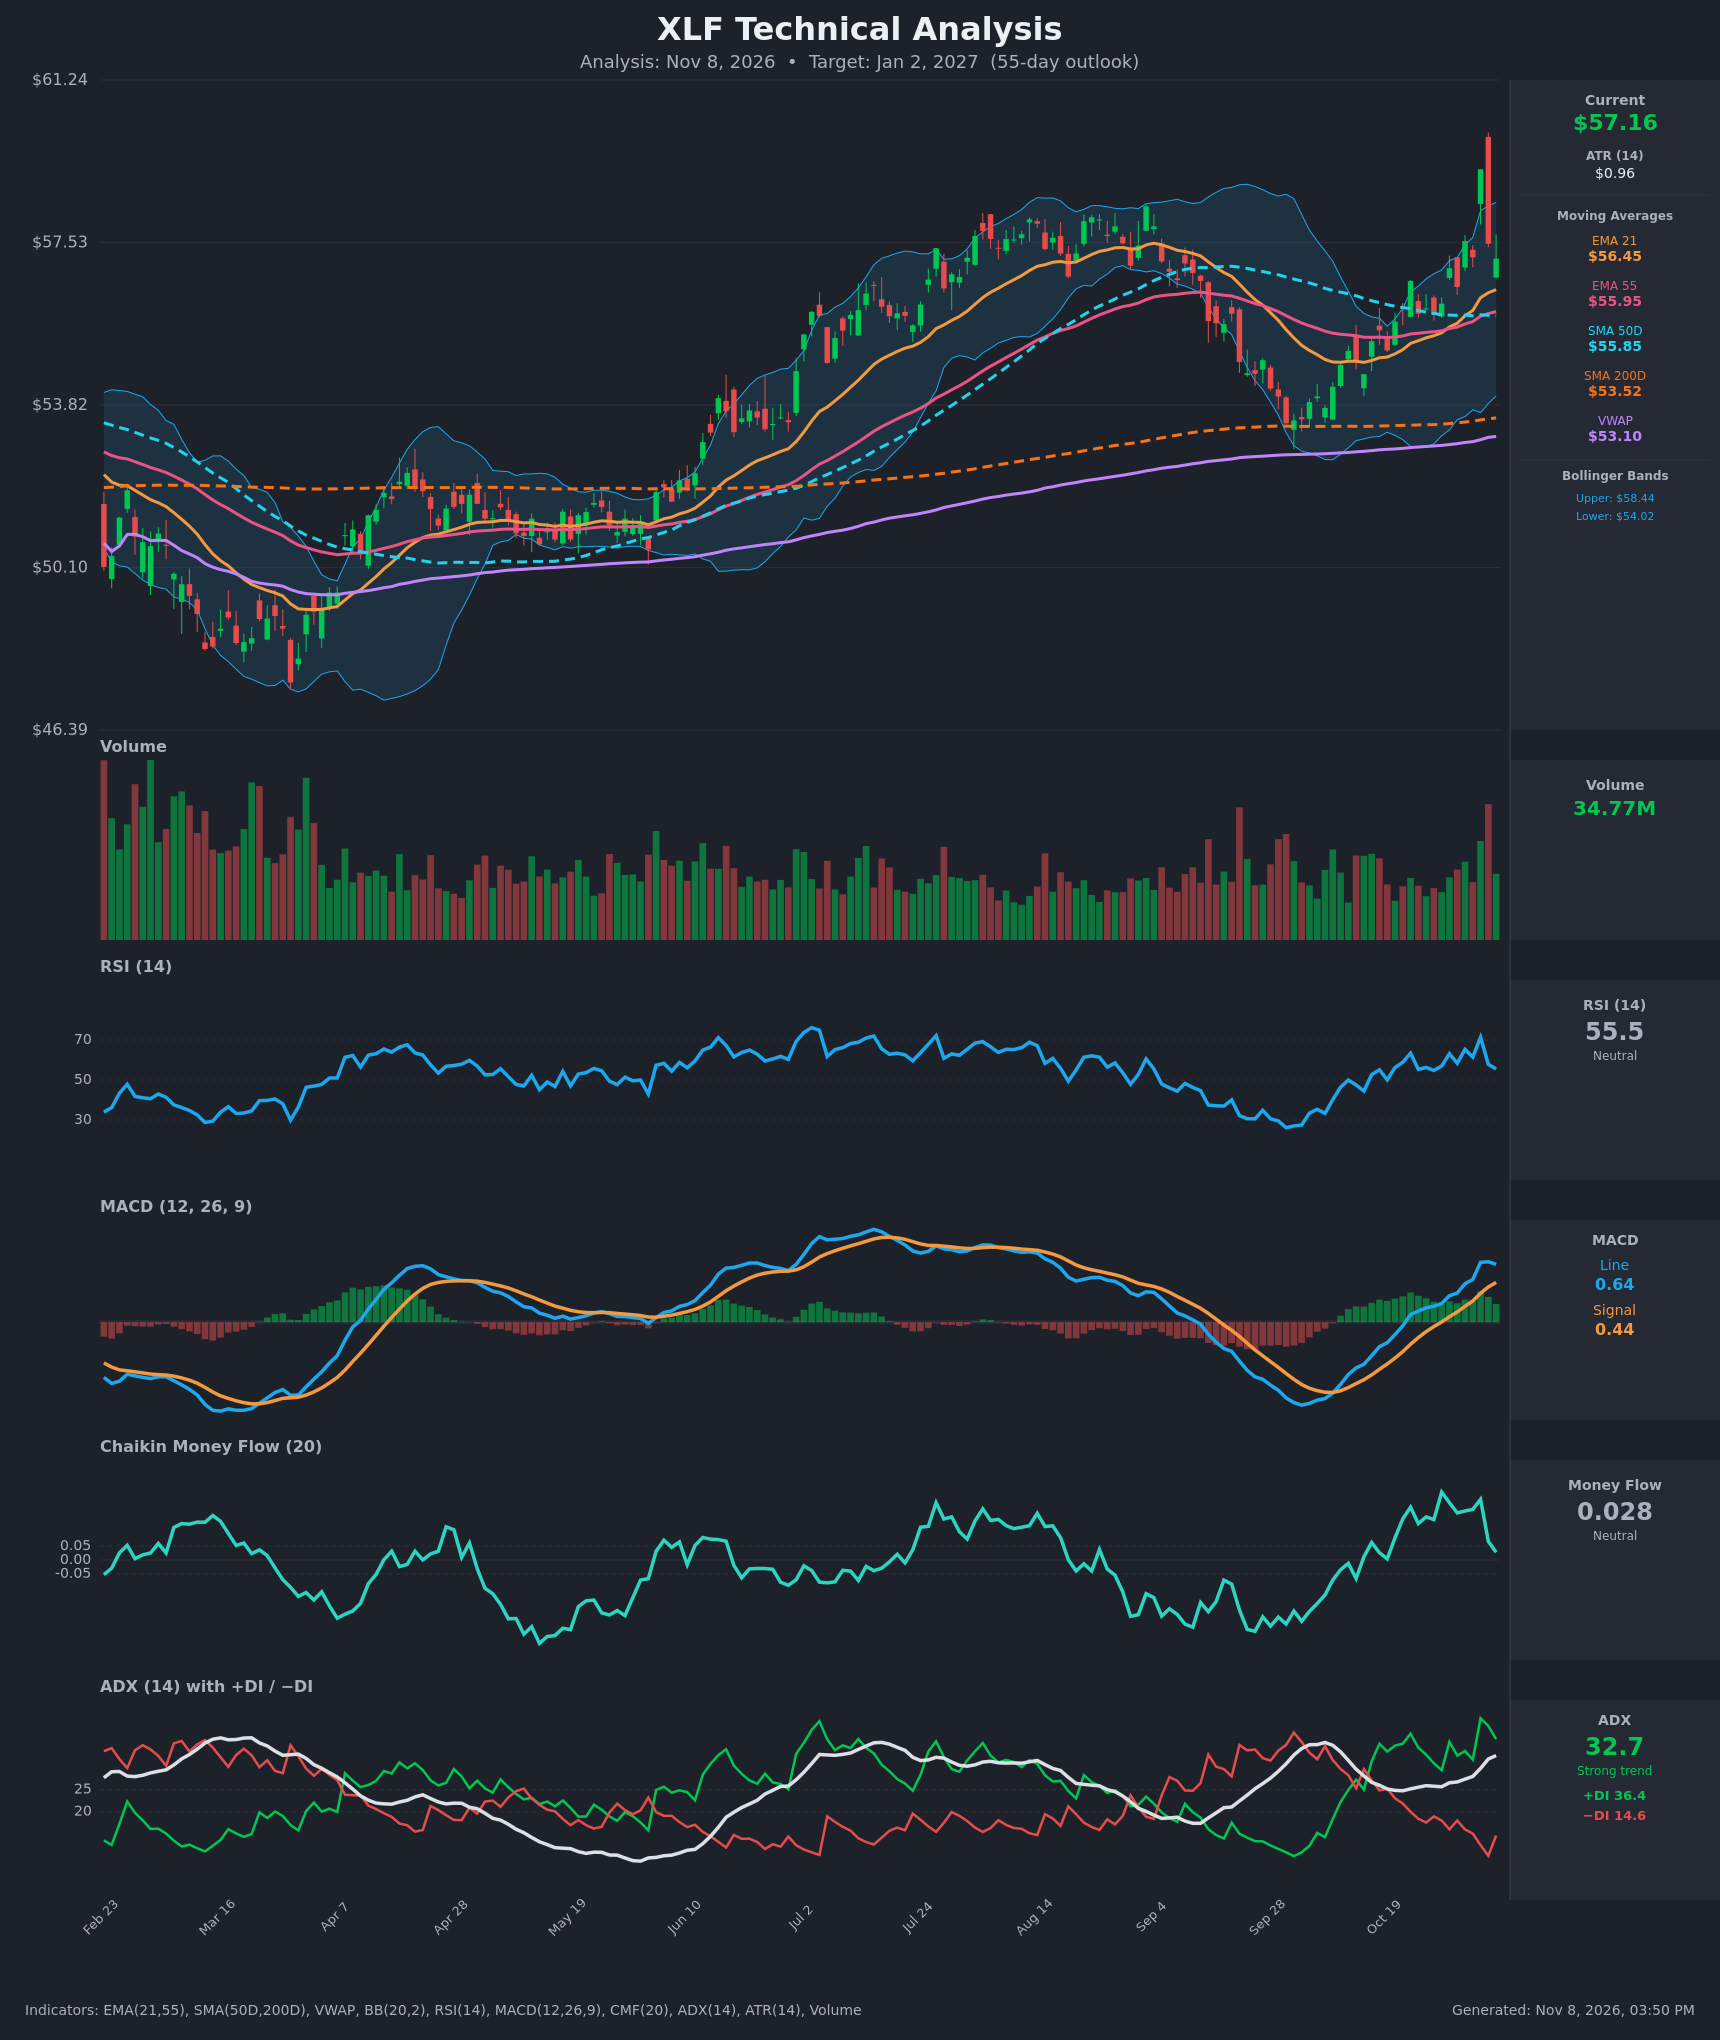
- RSI (14): 55.52, down from a spike to 71.4 on Nov 4 after the large green candle. It sits in neutral-bullish territory above 50, and the pullback from near-overbought has reset momentum without breaking the uptrend. [Bullish]
- 20 EMA (EMA 21): $56.45, with price at $57.16 above it. The EMA is rising and acting as near-term support. EMA21 is above EMA55 ($55.95), a bullish alignment that has held since the late-October crossover. [Bullish]
- MACD: Line 0.644 is above signal 0.443, with a positive histogram of about +0.20. The line crossed above the signal around Oct 28 and is above zero. The Nov 6 reading (0.644 vs 0.673 the day before) shows the line flattening, so momentum is cooling slightly but still constructive. [Bullish]
- Bollinger Bands (20): Upper $58.44, lower $54.02, midline around $56.23. Price is in the upper half of the bands. The Nov 4 spike to $59.20 broke above the upper band and was rejected the next day, a short-term exhaustion sign. The bands are widening after the volatility expansion. [Neutral]
- CMF (20): 0.028, between ±0.05 and down from 0.219 on Nov 4. Buying pressure has faded, and the Nov 4 reversal candle came on heavy volume. [Neutral]
- ADX (14): 32.7 and rising, with +DI 36.4 above −DI 14.6. That is a strong uptrend with bulls clearly in control, though +DI has come off its Nov 4 peak of 41.1. [Strong Trend + Bullish]
- Volume: 34.77M on the latest bar, after a very high-volume Nov 4 spike and reversal. Volume is elevated relative to the quiet October sessions. The Nov 4 blow-off bar showed some distribution, but the follow-through bars are holding gains. [Neutral to mildly Bullish]
DIVERGENCES & TRENDS
- No clear bearish RSI/price divergence yet. Price made a higher high on Nov 4 ($59.20) with RSI at 71.4, below its prior peaks of about 72–75 in July, so RSI is not confirming at long-term highs. That is a mild caution flag, not a divergence on this swing.
- CMF has rolled over from ~0.22 to 0.028 while price holds near highs. This is a small momentum divergence worth watching.
- MACD histogram is positive but flattening, which suggests the pace of the advance is slowing.
- Price recovered from the Sep lows (~$53) and held above the SMA200D ($53.52), a major long-term support. It has now reclaimed the EMA21, EMA55 and SMA50D, which are converging in the $55.85–$56.45 zone and now act as a support cluster.
- SMA50D ($55.85) is above SMA200D ($53.52), so the golden cross structure remains intact, and price is above VWAP ($53.10).
- ADX has climbed from about 25 to 32.7 with +DI dominant, which confirms trend strength.
CHART PATTERNS
- Bullish Flag / Continuation structure: The advance from the late-Sep low near $53 to the Nov 4 spike, followed by a pullback holding above the EMAs, resembles a bullish continuation. It is not a textbook flag.
- Bearish Double Top (cautionary): The July–August highs near $58 and the Nov 4 spike near $59.20 create a potential multi-month resistance zone of $58–59. A failure here would resemble a double top with a neckline around $53.5–54, near the SMA200D and September low. This is not confirmed, and price is currently above the prior highs only intraday.
- The recovery from the September low is a higher-low structure relative to the Apr lows ($47–50), so the long-term uptrend since spring is intact. A break above $59.20 would target roughly $61 (the chart's top at $61.24), a measured move of about the recent range.
POTENTIAL SCENARIOS
- Scenario 1: Bullish Trend Continuation — Price holds the EMA21/EMA55 support cluster ($56–56.45) and the strong ADX trend carries it through the $58.44–59.20 resistance zone. Trigger: daily close above $59.20 on solid volume. Target: $60.50–$61.50. Invalidation: close below $55.85 (SMA50D/EMA55 cluster). (50% probability)
- Scenario 2: Neutral Consolidation Below Highs — The Nov 4 blow-off rejection leads to a range between the EMA cluster and the prior highs as momentum cools. Trigger: failure to close above $58.50 with CMF staying near zero. Target: $55.50–$58.50 range. Invalidation: break outside either end of the range on strong volume. (28% probability)
- Scenario 3: Bearish Double-Top Reversal — Rejection at the $59 area develops into a lower high, with a slide through the EMA cluster and back toward the SMA200D. Trigger: close below $55.85 with MACD bearish crossover. Target: $53.50–$54.00. Invalidation: reclaim of $57.60 and continued strength. (22% probability)
PRICE TARGETS
- Target Price: $58.40 (55-day horizon, ending around Jan 2, 2027)
- Expected Range: $52.60 to $61.50 (width $8.90, about 15.6% of current price, consistent with the 30-60 day guidance of ~12-18%)
- Key Levels: Support at $55.85 (SMA50D/EMA55 cluster, with EMA21 at $56.45 just above), Resistance at $58.44 (upper Bollinger Band, followed by the Nov 4 high at $59.20)
OVERALL BIAS
OVERALL BIAS: BULLISH - ADX of 32.7 with +DI far above −DI, price above all key moving averages (EMA21, EMA55, SMA50D, SMA200D, VWAP), and a positive MACD all support further upside. The cooling CMF and the rejection from the Nov 4 spike keep the expected gain modest, around $58.40.
This is educational analysis and not financial advice.