AAL 55-day bullish forecast — Nov 8, 2026
- Bias: Bullish
- Timeframe: 55 days (made Nov 8, 2026, target date Jan 1, 2027)
- Price at analysis: $13.18
- Price target: $13.75
- Expected range: $12.10 – $14.30
- Result: Pending — graded after the close on Jan 1, 2027
Get a free AI analysis of AAL today
Analysis
TECHNICAL INDICATORS
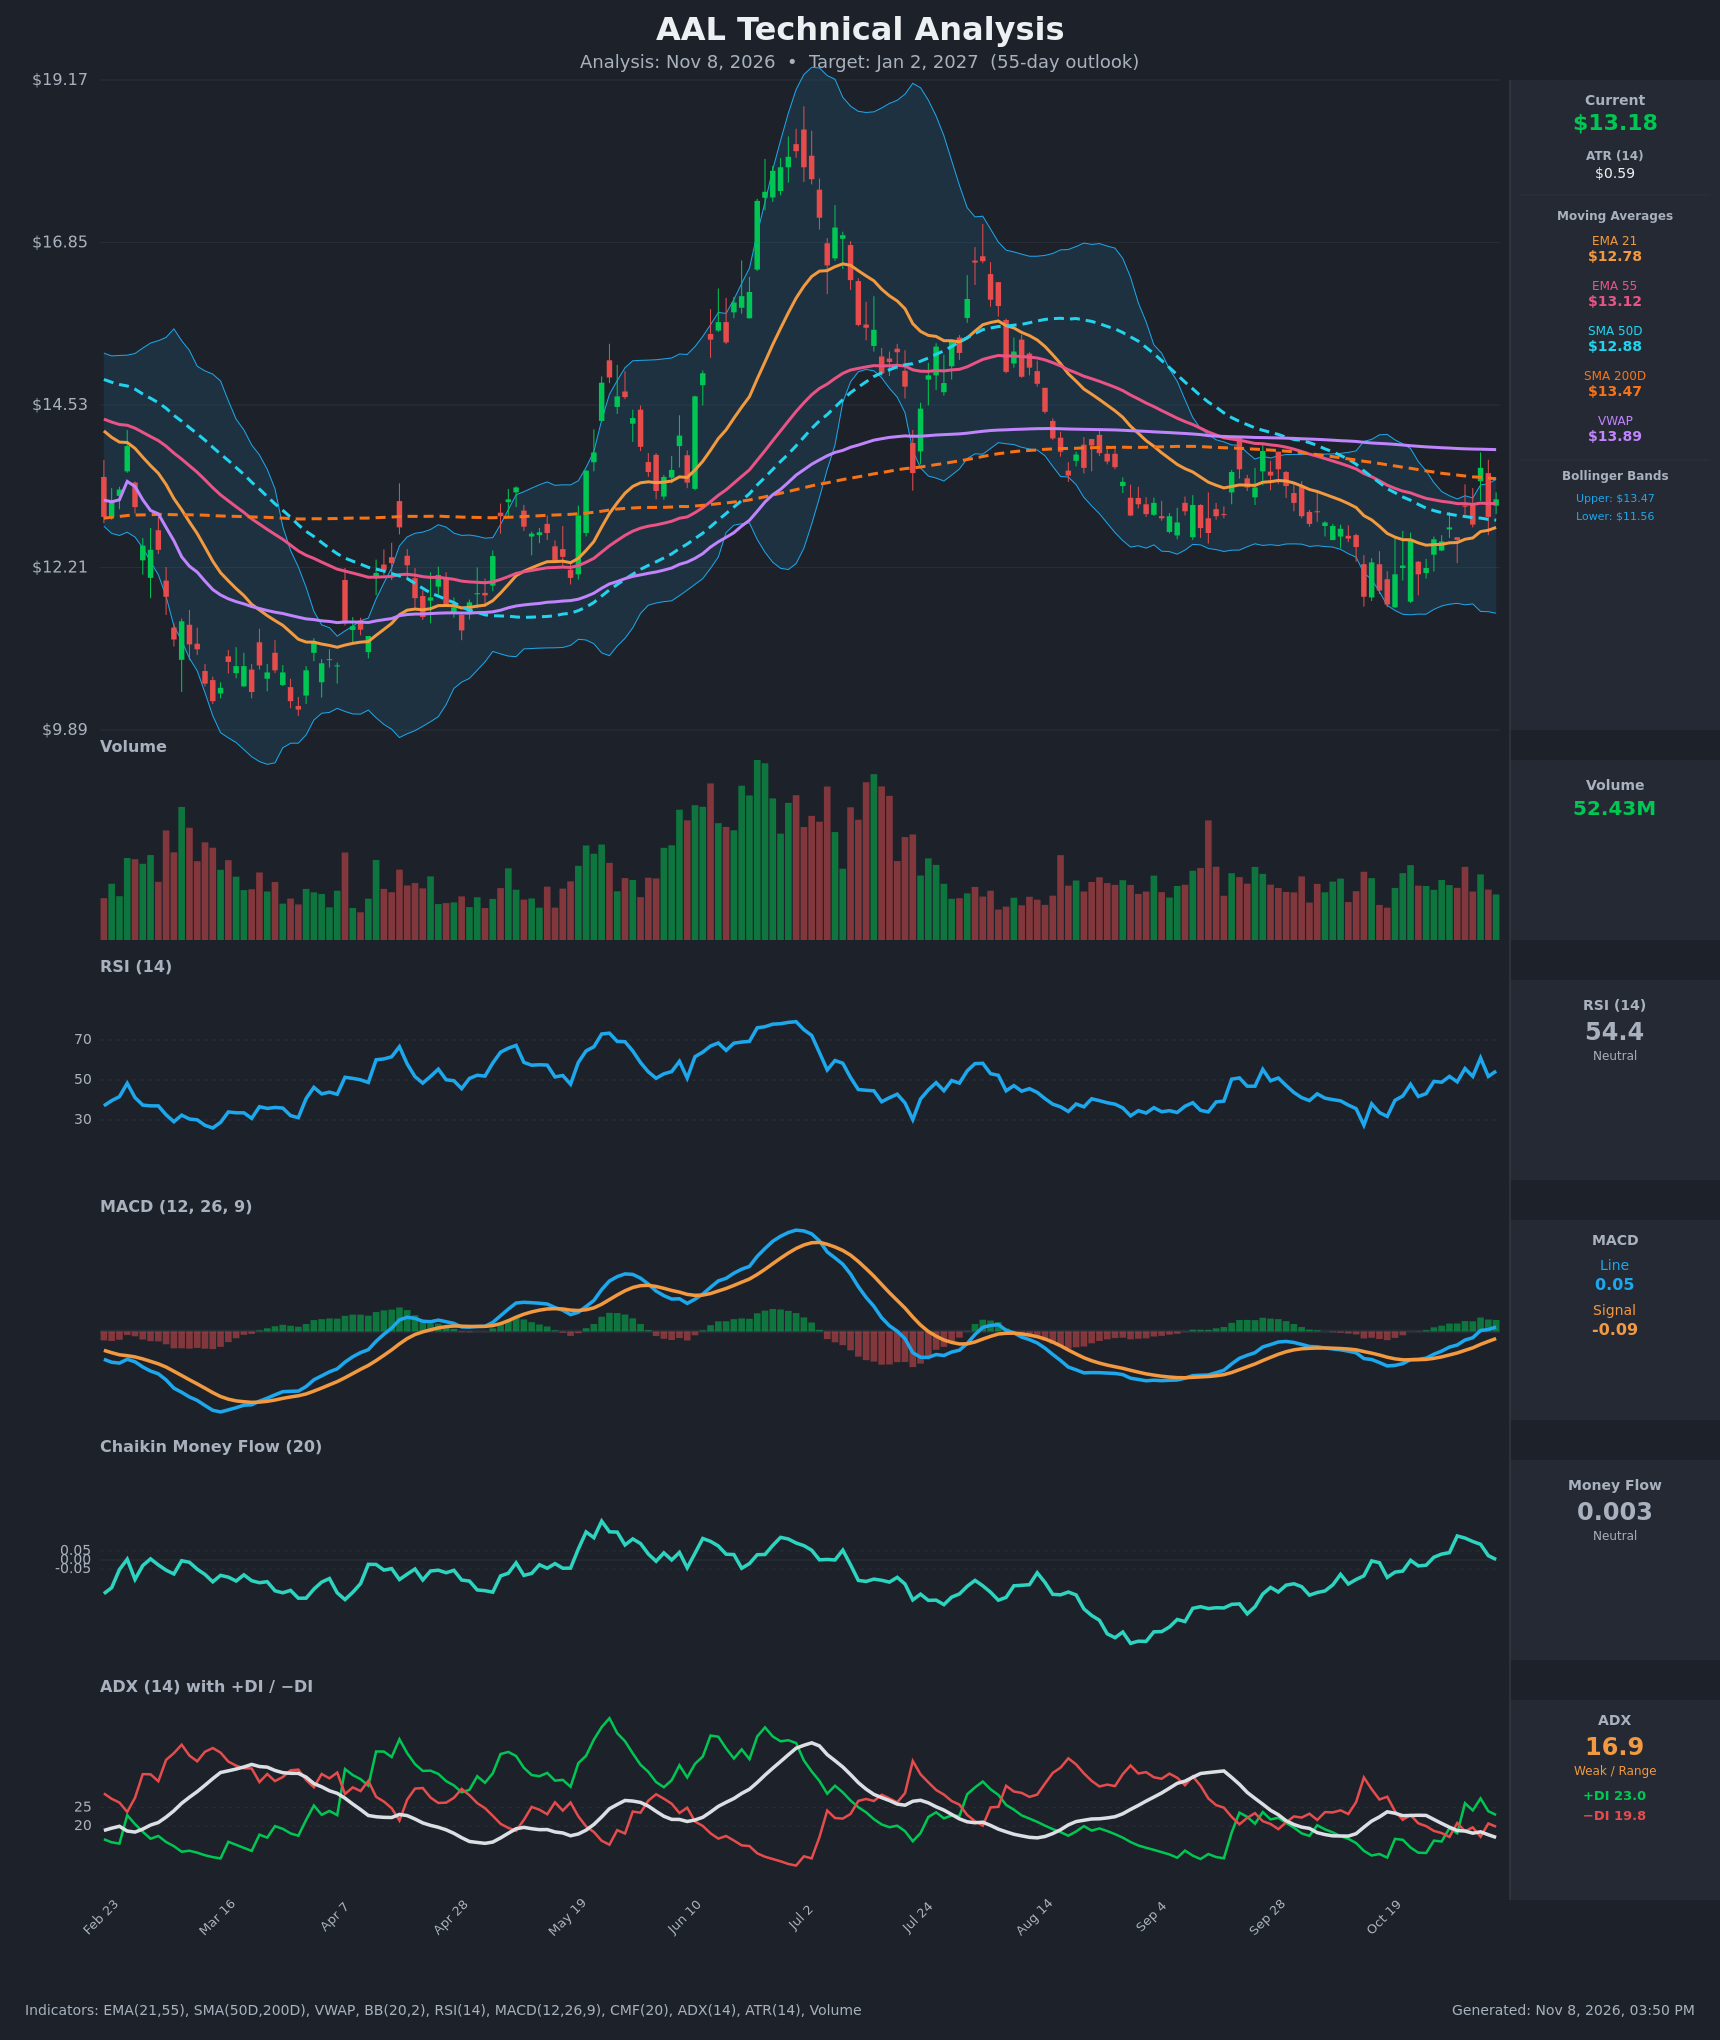
- RSI (14): 54.45, up from the oversold-adjacent 31.8 on Oct 19 and just below the 61 spike on Nov 4. Momentum is recovering but sits mid-range with no overbought or oversold signal. [Neutral]
- 20 EMA: The 21 EMA is $12.78 and price ($13.18) is above it, so it acts as support. The EMA is rising after bottoming near $12.53. The 21 EMA remains below the 55 EMA ($13.12), so there is no bullish EMA crossover yet, though the gap is narrowing. [Bullish]
- MACD: The line (0.053) crossed above the signal (-0.086) around Nov 4 and moved above zero. The histogram has turned positive and is expanding. This is a fresh bullish momentum shift from a deeply negative base. [Bullish]
- Bollinger Bands (20): Upper $13.47, lower $11.56, middle about $12.51. Price is in the upper half, about $0.29 below the upper band, after bouncing off the lower band. The bands are fairly narrow, which fits a range-bound environment. [Neutral]
- CMF (20): 0.003, inside the ±0.05 neutral zone. It peaked near +0.13 on Oct 30 and has faded back to zero, so buying pressure has not been sustained. [Neutral]
- ADX (14): 16.9 and falling, below 20, so the trend is weak and range-bound. +DI (23.0) is above −DI (19.8), a modest bullish edge after the Nov 2 crossover. [Weak Trend, slight bullish lean]
- Volume: 52.43M, in line with the average of recent months and well below the spring and summer surge. The bounce is not backed by strong volume, so there is no high-conviction breakout. [Neutral]
DIVERGENCES & TRENDS
- There is no clear price/RSI divergence. Price made a lower low in mid-October (about $11.6) and RSI held a similar low, but the recovery since then is trend-confirming rather than a divergence signal.
- MACD went from -0.416 to +0.053 in 14 sessions, a strong momentum turn that is leading price.
- Price has reclaimed the 21 EMA and SMA50D ($12.88) and is testing the EMA55 ($13.12). It is still below SMA200D ($13.475) and VWAP ($13.89), which form overhead resistance.
- SMA50D ($12.88) is below SMA200D ($13.475), so the long-term structure is still a death-cross configuration, although SMA50D has flattened.
- ADX is fading from about 24 to 16.9, which means the prior downtrend has exhausted without a new trend starting.
- CMF is flat at zero, so money flow is not confirming the bounce.
CHART PATTERNS
- Sideways range with a rounded base: Since August, price has oscillated between about $11.6 and $13.9. The October low near $11.6 and the higher lows since (about $12.1–$12.6) loosely resemble a Bullish Double Bottom / Bullish Falling Wedge reversal. A confirmed break above the neckline at the $13.47–$13.90 resistance cluster (SMA200D, upper Bollinger Band, VWAP) would measure toward about $14.5–$15.0.
- The pattern is not confirmed until price closes above $13.90. Until then, price is range-bound under resistance.
- Bearish risk: A failure at the SMA200D/VWAP cluster would resemble a lower-high within a Bearish Triple Top/Range, with a downside target back to the $11.6–$12.2 zone.
POTENTIAL SCENARIOS
- Scenario 1: Bullish Breakout Above SMA200/VWAP — Positive MACD and +DI dominance carry price through the $13.47–$13.90 resistance cluster, and the double-bottom/falling-wedge structure begins to play out. Trigger: daily close above $13.90 on rising volume. Target: $14.30–$14.80. Invalidation: close below $12.55 (below the 21 EMA and recent swing lows). (45% probability)
- Scenario 2: Neutral Range-Bound Chop — With ADX below 20 and CMF at zero, price oscillates between the 21 EMA and the SMA200D/VWAP cluster. Trigger: repeated rejections near $13.50–$13.90 and support at $12.78. Target: $12.60–$13.60. Invalidation: close above $13.90 or below $12.40. (30% probability)
- Scenario 3: Bearish Rejection and Retest of Lows — Price is rejected at SMA200D/VWAP, the MACD bounce fades, and sellers push price back toward the lower Bollinger Band. Trigger: close below $12.55 and a MACD bearish recross. Target: $11.60–$12.10. Invalidation: close above $13.90. (25% probability)
PRICE TARGETS
- Target Price: $13.75 (55-day, Jan 2, 2027)
- Expected Range: $12.10 to $14.30 (width $2.20, about 16.7% of current price, consistent with the 30–60 day guidance of 12–18%)
- Key Levels: Support at $12.78 (21 EMA; next at $12.55 and $11.60), Resistance at $13.47 (SMA200D; then $13.89 VWAP)
OVERALL BIAS
OVERALL BIAS: BULLISH - A fresh MACD bullish crossover, +DI above −DI, and price reclaiming the 21 EMA and SMA50D after a bounce from the lower Bollinger Band point to modest upside. Conviction is limited by weak ADX, flat CMF, and the SMA200D/VWAP resistance overhead.
This is educational analysis and not financial advice.