AAPL 55-day bullish forecast — Nov 8, 2026
- Bias: Bullish
- Timeframe: 55 days (made Nov 8, 2026, target date Jan 1, 2027)
- Price at analysis: $342.37
- Price target: $353.50
- Expected range: $320.00 – $368.00
- Result: Pending — graded after the close on Jan 1, 2027
Get a free AI analysis of AAPL today
Analysis
TECHNICAL INDICATORS
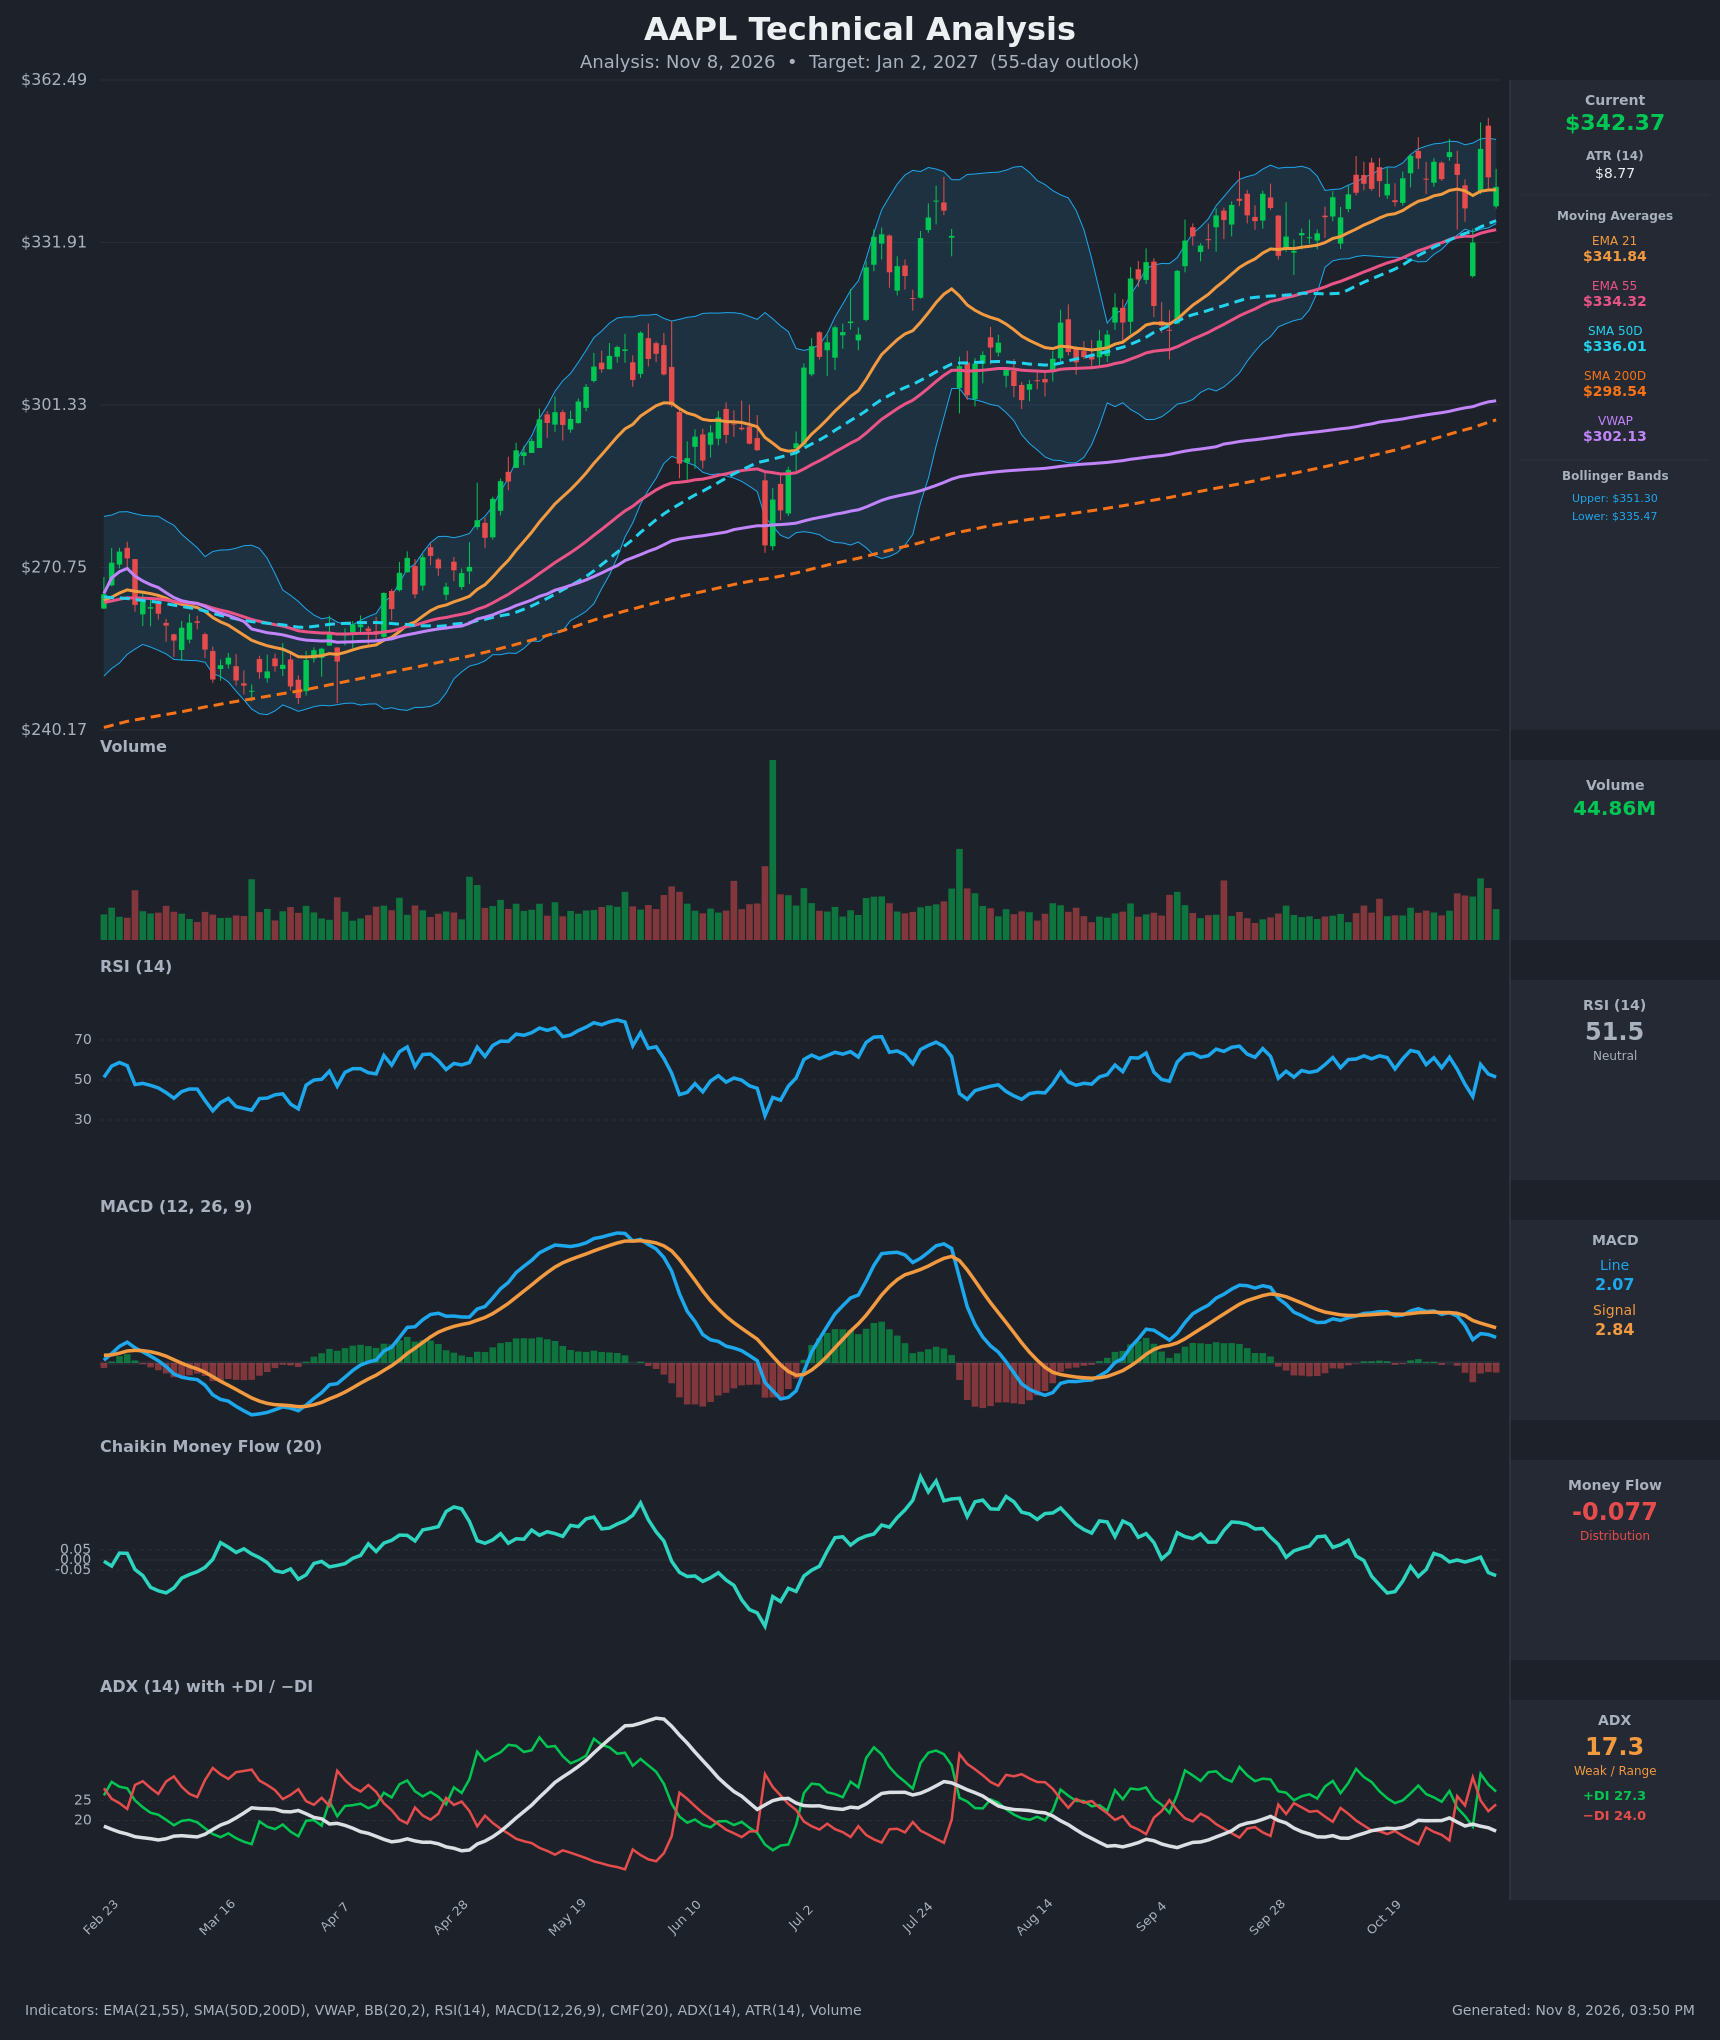
- RSI (14): 51.46, neutral, down from 64.8 on Oct 22. It dipped to 41.7 on Nov 3 and rebounded to 57.8, so momentum has cooled but not broken. Peaks are lower (64.8, then 61.4, then 57.8) while price is near its highs. [Neutral]
- 20 EMA: The EMA 21 is $341.84 and price ($342.37) sits just above it, so it is acting as marginal support. The EMA 21 is above the EMA 55 ($334.32), so the short-term trend structure is intact, but the gap between price and the EMA is nearly zero. [Neutral]
- MACD: Line 2.07 is below signal 2.84, with a histogram of about -0.77. The line crossed below the signal around Oct 29 and the gap has widened since. It is still above zero, so this is a pullback in momentum inside a larger uptrend. [Bearish]
- Bollinger Bands (20): The upper band is $351.30 and the lower band is $335.47, so the middle band is about $343.4. Price is just under the midline. The bands are narrow compared with the summer expansion, which points to a volatility squeeze and a pending expansion. The Nov 3 low at $331.90 pierced the lower band and was bought immediately. [Neutral]
- CMF (20): -0.077 is below the -0.05 threshold, which signals mild distribution. It has hovered around zero to negative for weeks even as price made new highs, so buying conviction is lacking. [Distribution]
- ADX (14): 17.3 with +DI 27.3 and -DI 24.0. ADX is below 20, so there is no strong trend and price is range-bound. +DI is still above -DI, but the lead has narrowed sharply. -DI briefly crossed above +DI on Oct 30 and Nov 3 before bulls retook control. [Weak Trend, slight bullish lean]
- Volume: 44.86M, which is average to slightly below average. Volume was elevated on the Nov 3-4 flush and reversal. The spikes on the large red candles show that sellers appear on dips but get absorbed. There is no volume confirmation for a decisive breakout yet. [Neutral]
Moving-average context:
- Long-term trend: Price is above SMA200D ($298.54), SMA50D ($336.01), EMA 55 and VWAP ($302.13), a clear long-term uptrend.
- Golden cross: SMA50D is well above SMA200D, so the golden cross is long established and is a major bullish backdrop.
- Rising averages: All the moving averages are sloping upward.
DIVERGENCES & TRENDS
- RSI divergence: Price made higher highs (about $348-349) while RSI made lower highs (64.8, then 61.4, then 57.8). This is a mild bearish divergence.
- MACD divergence: The MACD peak of 4.37 on Oct 23 has since fallen to 2.07 while price held near highs. This is another mild bearish divergence, and the bearish signal-line cross confirms it.
- CMF divergence: CMF is negative while price is near its highs, which shows distribution under the surface.
- Support holding: The Nov 3 dip to $331.90 was bought sharply, with a +$17.6 close-to-close reversal on Nov 4. Price has held above the EMA 55 and SMA50D, and higher lows are intact on the larger trend.
- Trend strength: ADX is flat to falling at 17-20, so trend strength is lacking and a sideways grind of roughly $332-$350 has been forming for about three weeks.
- Crossovers: The EMA 21 / EMA 55 spread is positive and stable. The MACD is bearish and the DI spread is narrowing, but no major MA crossovers are imminent.
Evidence is mixed: the larger structure is bullish and short-term momentum is soft. I weigh the intact long-term uptrend and the strong dip-buying slightly more than the fading momentum.
CHART PATTERNS
- Primary pattern: A rectangle / bullish flag-like consolidation (closest to the Bullish Flag and Ascending Triangle reference patterns) within an established uptrend, bounded by roughly $332 support and $349-$355 resistance. The Nov 3 wick below the lower band that was bought immediately resembles a failed breakdown or spring.
- Bullish resolution: A close above about $355 would project a measured move of about +$20-23 (the height of the prior rally leg) to the $370-$378 area. Over 55 days I haircut this to roughly $354-$365 given weak ADX.
- Bearish alternative: Repeated failures near $349 with lower RSI highs could resemble a double top / triple top. A breakdown below $331.90 would target about $315 (range height), then the SMA200D region around $300.
POTENTIAL SCENARIOS
- Scenario 1: Bullish Range Breakout and Trend Continuation — The uptrend resumes as the consolidation resolves upward, with price holding the SMA50D/EMA 55 zone and MACD turning back above its signal. Trigger: daily close above $355 on rising volume, with MACD re-crossing above signal and CMF above +0.05. Target: $365-$370 (primary target about $353.50 at day 55 on a probability-weighted basis). Invalidation: daily close below $331.90. (50% probability)
- Scenario 2: Neutral Range-Bound Chop — Price keeps oscillating between about $332 and $350 as ADX stays below 20 and the moving averages catch up. Trigger: repeated rejections at $349-$351 and bounces at $335-$336. Target: $338-$348. Invalidation: close outside $331.90-$355. (20% probability)
- Scenario 3: Bearish Breakdown and Mean Reversion — Distribution (negative CMF) and fading momentum cause a break of the range, with a retest of the moving averages. Trigger: close below $331.90 with MACD falling further below signal and -DI above +DI. Target: $315, then $300-$305 near the SMA200D/VWAP. Invalidation: reclaim of $344 (EMA 21) and then $351. (30% probability)
PRICE TARGETS
Timeframe: 55 days (about Jan 2, 2027), so a 12-18% range-width band applies. Self-check: range $320.00 to $368.00 gives a $48.00 width, which is 14.0% of $342.37, within the 12-18% band.
- Target Price: $353.50 (55 days)
- Expected Range: $320.00 to $368.00
- Key Levels: Support at $336.01 (SMA50D, with the Bollinger lower band at $335.47 just below), Resistance at $355.00 (recent swing high and wick area)
OVERALL BIAS
OVERALL BIAS: BULLISH - Price is in a well-established long-term uptrend, above the rising SMA50D, SMA200D and EMA 55, and the Nov 3 flush was bought aggressively. Short-term momentum is soft (MACD below signal, CMF negative, ADX under 20), so conviction is modest and a $336/$332 breakdown would invalidate the call.
This is educational analysis and not financial advice.