CRWV 55-day bearish forecast — Nov 8, 2026
- Bias: Bearish
- Timeframe: 55 days (made Nov 8, 2026, target date Jan 1, 2027)
- Price at analysis: $46.40
- Price target: $42.00
- Expected range: $34.50 – $54.00
- Result: Pending — graded after the close on Jan 1, 2027
Get a free AI analysis of CRWV today
Analysis
TECHNICAL INDICATORS
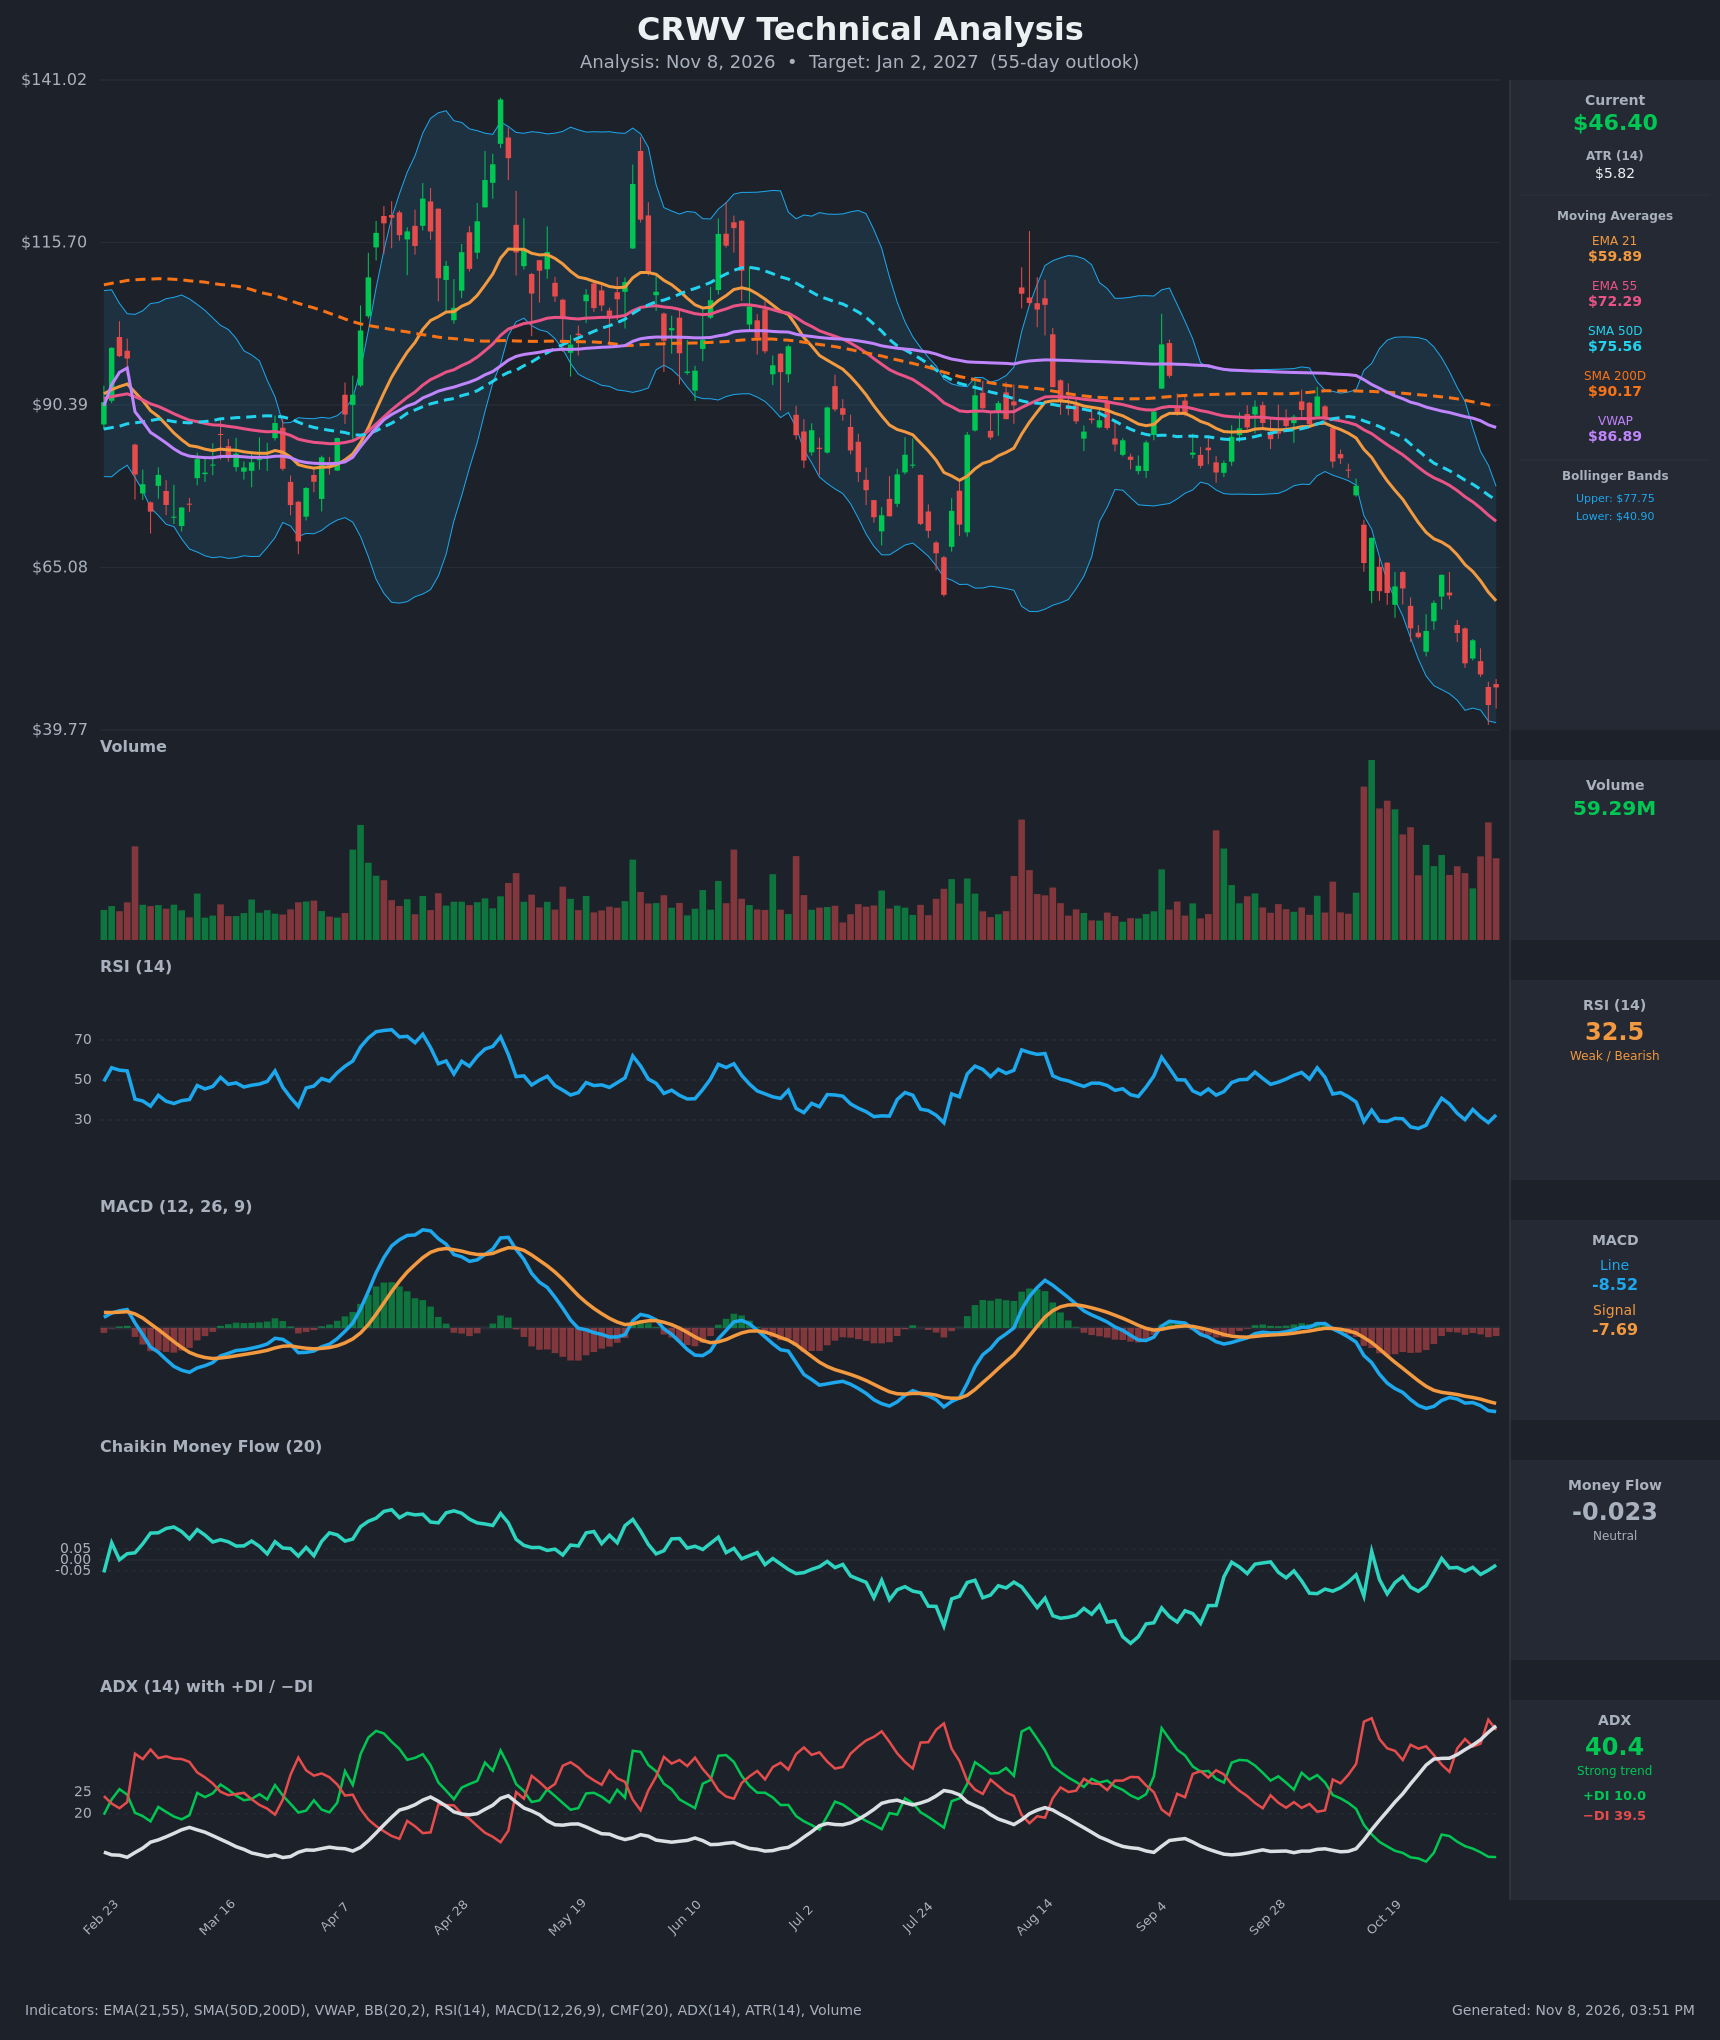
- RSI (14): 32.51, hovering just above oversold (30) after dipping to 28.7 on Nov 5. It has been stuck in the 26-35 zone for weeks. A bounce to 40 on Oct 28 failed immediately. Momentum is weak with no bullish divergence yet. [Bearish]
- 20 EMA: The closest tracked value is EMA 21 at $59.89, with price at $46.40, about 22% below it. EMA 21 is falling steeply (from $78.59 on Oct 19) and acts as strong overhead resistance. EMA 55 ($72.29) is also falling and sits above EMA 21, so the EMA stack is bearish. [Bearish]
- MACD: Line -8.52 is below signal -7.69, histogram about -0.83. The line has stayed under the signal since early October and is making new lows. The histogram is expanding negative again. No bullish crossover. [Bearish]
- Bollinger Bands (20): Upper $77.75, lower $40.90, with price at $46.40 in the lower third. Price has been walking the lower band for two weeks. Bands are wide, which signals high volatility. In a strong trend, band-walking is continuation rather than a reversal signal. A mean-reversion bounce toward the midline (~$59) is possible. [Bearish]
- CMF (20): -0.023, inside the neutral band (±0.05). It has improved from -0.155 on Oct 19, so selling pressure is easing. Price is falling faster than money flow is deteriorating, which is a mild positive divergence. [Neutral]
- ADX (14): 40.4 and rising sharply, a strong trend. -DI 39.5 is far above +DI 10.0, so bears are in full control. The gap is wide, with no DI crossover in sight. [Strong Trend – Bearish]
- Volume: 59.29M is elevated, in line with the heavy volume of the recent selloff. The largest spikes occurred on red candles during the October breakdown. Heavy volume on declines with only weak bounces signals persistent distribution, though it could also hint at capitulation. [Bearish – elevated selling volume]
DIVERGENCES & TRENDS
- Death cross: SMA50D ($75.56) is below SMA200D ($90.17), and the gap is widening. Price is below SMA200D, VWAP ($86.89), SMA50D, EMA21, and EMA55, a fully bearish alignment.
- Moving average structure: EMA21 < EMA55 < SMA50D < SMA200D, all sloping down. This is a textbook downtrend stack.
- MACD: The line is making new lows (-8.52 vs. -7.9 on Oct 23 and -5.6 on Oct 19). There is no momentum divergence, just trend confirmation.
- RSI/price: Price made a lower low ($43.66 on Nov 5) while RSI hit 28.7, versus 25.8 on Oct 23. That is a slight RSI higher low, a minor bullish divergence at best, and it hasn't been confirmed by a break of any downtrend line.
- CMF: Rising from -0.155 to -0.023 while price made new lows is a mild positive divergence. It suggests selling is losing intensity.
- ADX: Rising from about 20 to 40 shows a trend accelerating, and trends at ADX 40+ often exhaust in the near term, so a relief bounce is possible.
- Price action: Lower highs and lower lows since the $63.93 high on Oct 28. The stock has fallen from ~$115 to $46.40.
CHART PATTERNS
- Primary pattern: a prolonged downtrend that formed a bearish continuation structure (similar to the Bearish Flag/Pennant). Price consolidated around $85-90 in Aug-Sep, then broke down hard in October.
- Bearish head-and-shoulders-like topping structure: the Apr-May peak (~$138) was followed by lower highs in Aug (~$110) and Sep (~$95). The neckline break near $85-90 projects a lower measured move.
- Recent bounces: the late-Oct and early-Nov rallies ($63.93 and $53.74) look like small bear flags within a falling channel, projecting continuation lower.
- Potential bullish reversal: a Falling Wedge could be forming if the lower highs and lower lows converge, but there is no confirmation yet. A close above $54-55 would be the first sign of change.
- Targets: the measured move from the October breakdown flag (~$85 → $55 range, then lower) suggests extension toward the $35-40 area if the $40.90 lower band fails.
POTENTIAL SCENARIOS
- Scenario 1: Bearish Trend Continuation — The strong downtrend (ADX 40, -DI dominant, death cross, price below all MAs) continues. Rallies are sold into EMA21 resistance and the lows are retested and broken. Trigger: close below $43.66 (Nov 5 low) / lower Bollinger Band $40.90. Target: $36-40, with extension toward $32. Invalidation: daily close above $59.89 (EMA21). (50% probability)
- Scenario 2: Bullish Relief Bounce, Then Fade — Oversold RSI, improving CMF and an extended distance from the moving averages trigger a mean-reversion bounce toward the 20-day midline, which stalls at EMA21 and fails. Trigger: close above $54-55 on rising volume. Target: $55-60. Invalidation: close below $43. (35% probability)
- Scenario 3: Neutral Base Building — Price stabilizes at $40-52 as selling exhausts and volume fades, forming a base. Trigger: several closes in the $42-52 range with RSI between 35 and 45. Target: $44-50. Invalidation: break of either end of the range with volume. (15% probability)
PRICE TARGETS
Timeframe: 55 days (range width guideline 12-18% for 30-60 days, widened slightly because ATR is $5.82 and volatility is high).
- Target Price: $42.00 (55 days)
- Expected Range: $34.50 to $54.00 (width $19.50 = ~42% of the current price; the ATR of $5.82 implies a 55-day sigma of ~$43, so wider than the standard guideline is warranted for this extremely volatile stock)
- Key Levels: Support at $40.90 (lower Bollinger Band), then $36.00. Resistance at $54.00 (prior bounce zone), then $59.89 (EMA21).
OVERALL BIAS
OVERALL BIAS: BEARISH - A confirmed downtrend (ADX 40.4 with -DI 39.5 vs. +DI 10.0), a death cross, price below every major moving average, and a MACD below its signal and making new lows all favor continuation lower. A relief bounce toward $54-60 is plausible given the oversold RSI and improving CMF, but it is likely to meet heavy resistance at EMA21.
This is educational analysis and not financial advice.