AMD 55-day bearish forecast — Nov 8, 2026
- Bias: Bearish
- Timeframe: 55 days (made Nov 8, 2026, target date Jan 1, 2027)
- Price at analysis: $449.04
- Price target: $418.00
- Expected range: $380.00 – $462.00
- Result: Pending — graded after the close on Jan 1, 2027
Get a free AI analysis of AMD today
Analysis
TECHNICAL INDICATORS
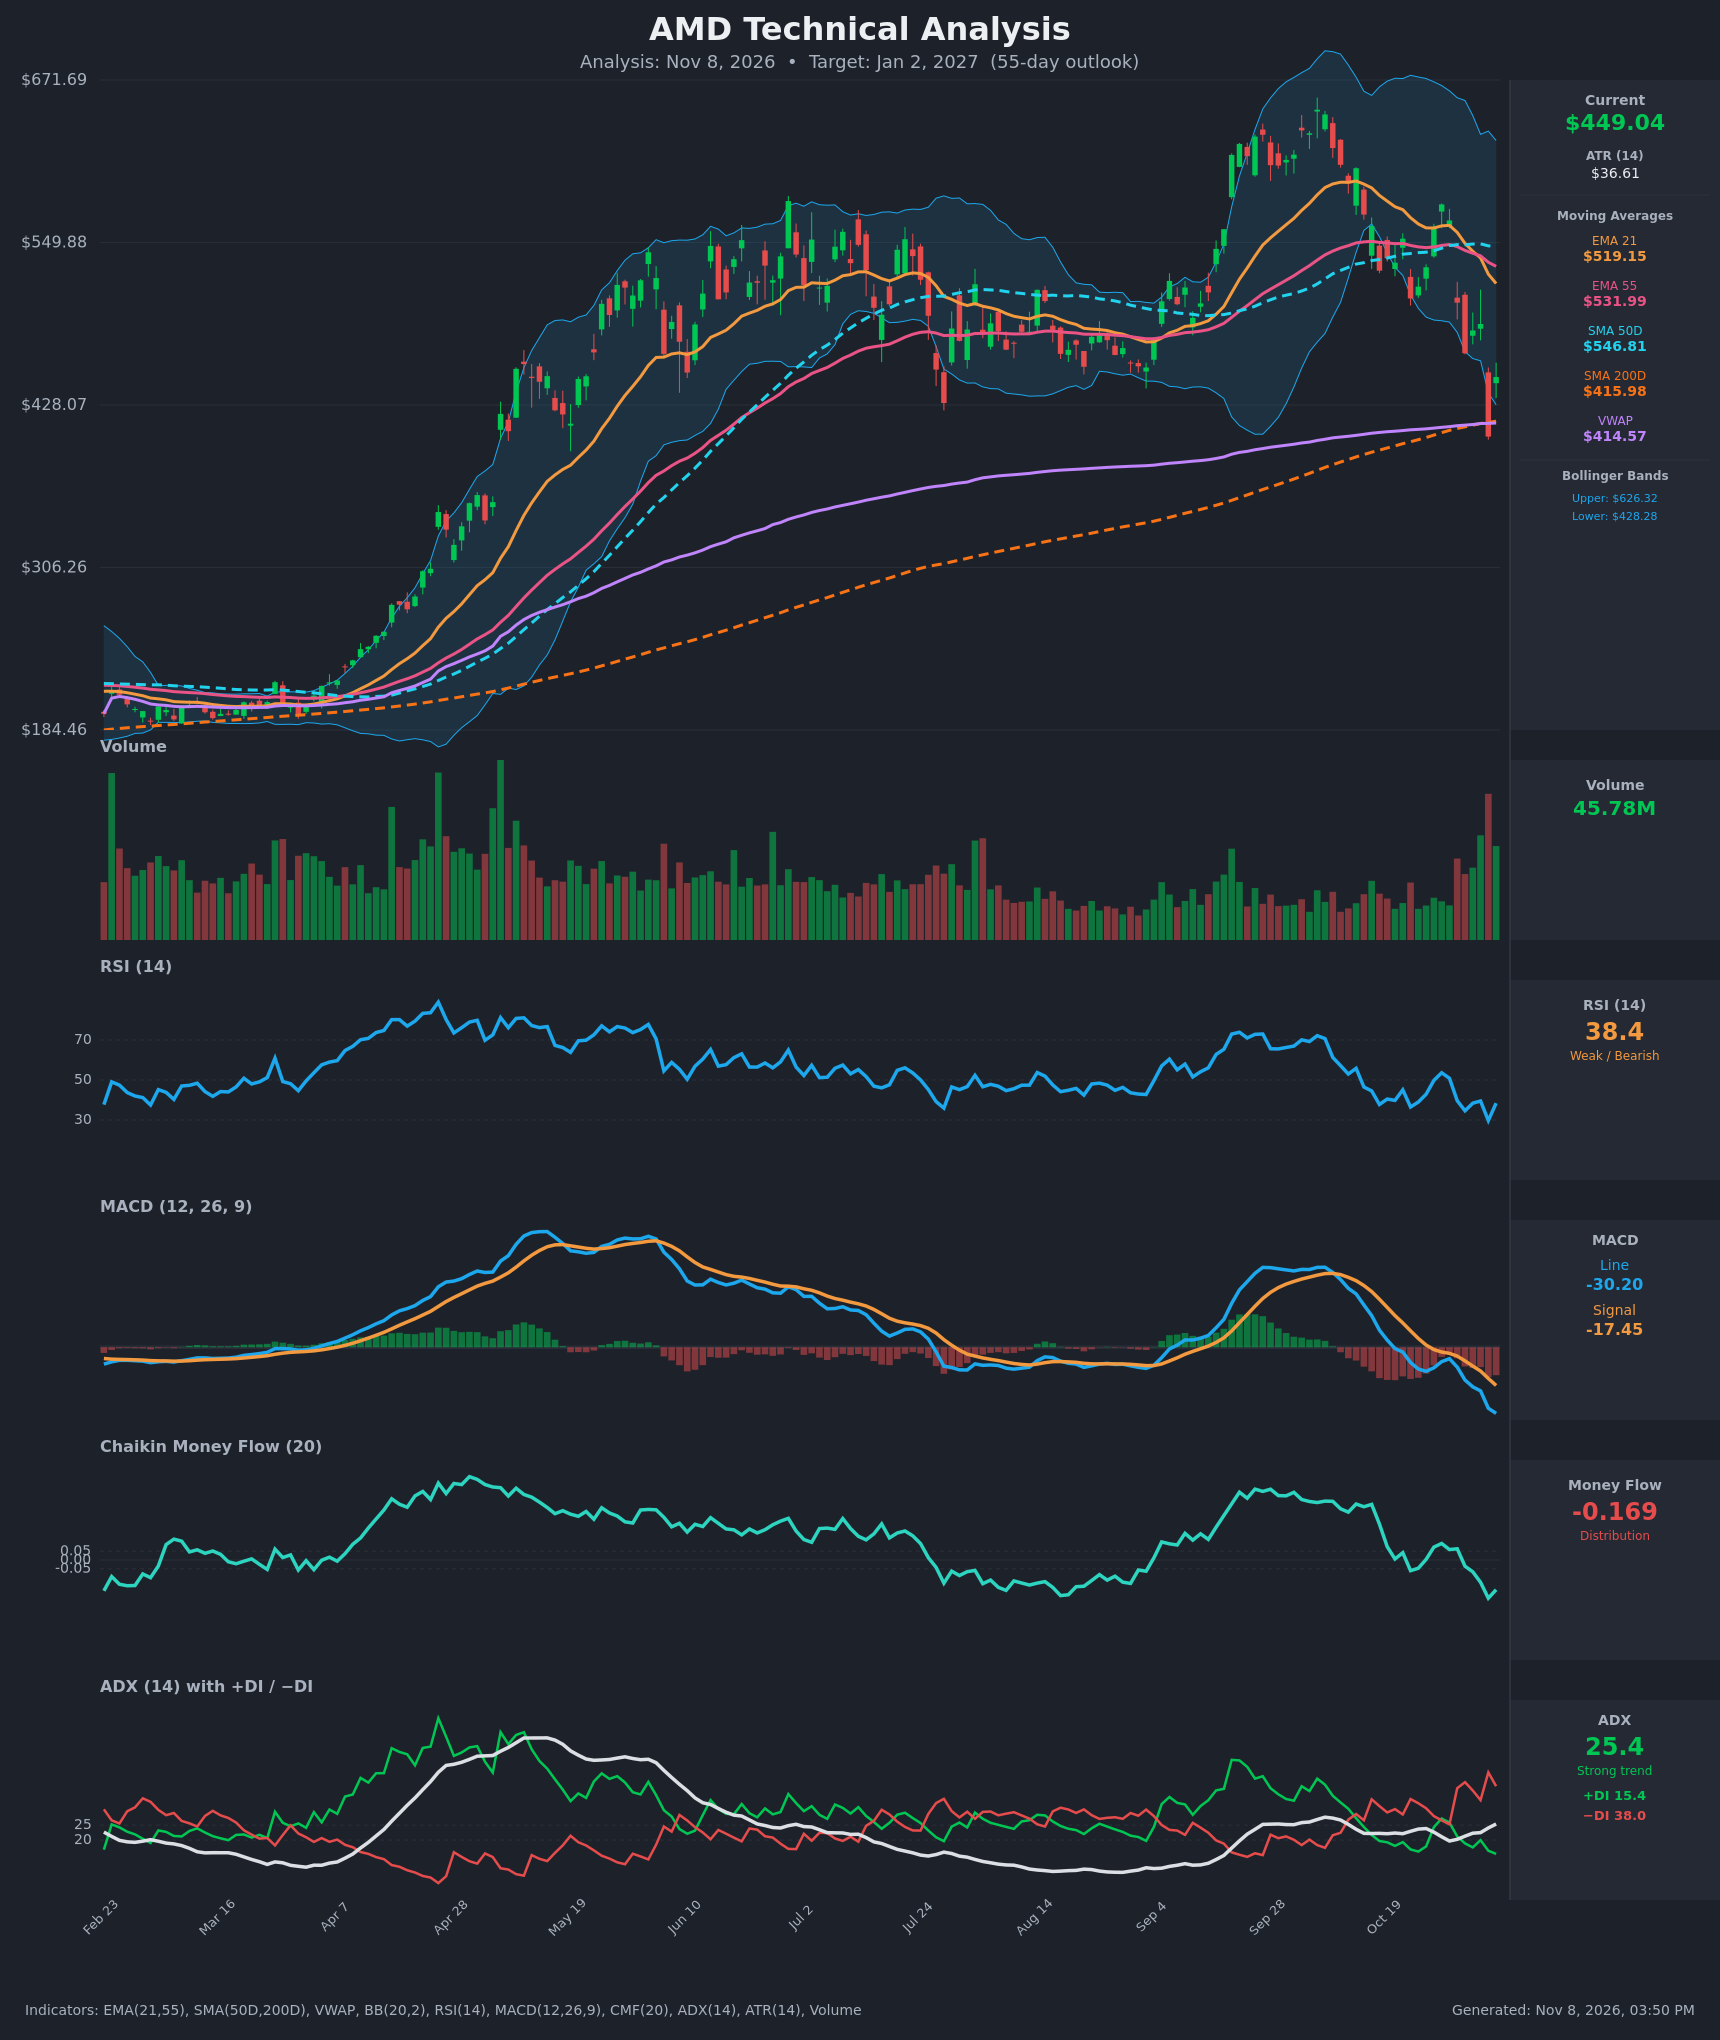
- RSI (14): 38.41, rebounding from 29.7 on Nov 5 but still below 40 and well under the 50 midline. The bounce is only a partial recovery from near-oversold. Momentum remains weak, with no bullish regime yet. [Bearish]
- 20 EMA: The chart plots the EMA 21 at $519.15, about 15.6% above price. Price has been below it since Oct 30 and the slope is steeply down. EMA21 also crossed below EMA55 ($531.99) around Nov 4, so the EMA is overhead resistance. [Bearish]
- MACD: Line at -30.20 vs signal at -17.45, giving a histogram of about -12.8. The line has been below the signal since late October and the gap keeps widening. The line has made a new low well below zero. No bullish crossover is in sight. [Bearish]
- Bollinger Bands (20): Upper $626.32, lower $428.28, midline about $527. Price at $449.04 sits in the lower quarter of the bands. It pierced the lower band on Nov 5 (close $404.40) and re-entered, which is a possible bounce signal. The bands are wide, so volatility is elevated, and the midline is still far above and falling. [Bearish]
- CMF (20): -0.169, well below -0.05, and it has fallen from positive readings in October. This is clear, sustained distribution with sellers dominating volume flow. [Distribution]
- ADX (14): 25.4 and rising, so the trend is strong. -DI at 38.0 is far above +DI at 15.4, so bears are in firm control. [Strong Trend – Bearish]
- Volume: 45.78M, elevated, with the largest bars of the recent period on the sharp Nov 5 selloff. This looks like a high-volume flush into the SMA200/VWAP zone. It shows the selling is heavy, though it can also mark short-term capitulation. [Heavy selling, possible exhaustion]
DIVERGENCES & TRENDS
- No clean bullish divergence yet. RSI's Nov 5 low (29.7) came with a price low of $404.40. The current bounce is on RSI 38 and a still-falling MACD, so momentum is not improving.
- The price structure has rolled over. After a peak in the $650s, the Oct 28 rebound topped near $578, a lower high. The decline from there has been steep (about -30% to the Nov 5 low).
- The EMA21 / EMA55 crossover to the downside (Nov 4) is confirmed. Price is below the EMA21, EMA55 and SMA50D ($546.81), all of which are rolling over.
- There is no death cross. The SMA50D ($546.81) is still far above the SMA200D ($415.98), so the long-term trend is still technically up. Price is above the SMA200D by about 8%.
- The Nov 5 low at $404.40 tested the SMA200D/VWAP confluence at about $415, and price recovered to $449. That is the main support test, and it has held so far.
- -DI is expanding while +DI fades. ADX is climbing from the high teens to above 25, which confirms a developing downtrend.
CHART PATTERNS
- Bearish Double Top / topping structure (loose): Price peaked in the $650s, made a lower high near $578, and has broken the Aug–Oct base. The "neckline" sits in the $404–$430 zone, which lines up with the SMA200D/VWAP and the Nov 5 low. A confirmed close below about $404 would trigger the pattern. The textbook measured move is very large, so a more conservative continuation toward $360–$380 is reasonable.
- Bearish continuation setup: The bounce from $404 to $449 so far looks like a corrective rally inside a downtrend, with the EMA21 and the $488.78 close as the likely ceilings. A rejection there would resemble a Bearish Flag.
- Counter-signal: The long lower wick on Nov 5 at the SMA200D/VWAP, plus the green candle on Nov 6, could develop into a base. A move back above $519 (EMA21) would be needed to call it a Bullish Double Bottom.
POTENTIAL SCENARIOS
- Scenario 1: Bearish Breakdown Through the 200-Day Zone — Sellers retain control (-DI 38, CMF -0.17, widening MACD gap). After a weak bounce, price fails near the $488–$520 resistance zone and loses the SMA200D/VWAP cluster near $415. Trigger: daily close below $404.40, or a rejection at $488.78 or the EMA21. Target: $380–$400, with extension to about $360. Invalidation: daily close above $519 (EMA21). (50% probability)
- Scenario 2: Bullish Relief Rally / Base Formation — The Nov 5 flush into the SMA200D/VWAP becomes a capitulation low. RSI recovers above 50 and price mean-reverts toward the falling EMAs. Trigger: close above $488.78 with improving CMF. Target: $520–$535 (EMA21 / EMA55), with a stretch to the $547 SMA50D. Invalidation: close below $404. (30% probability)
- Scenario 3: Neutral Choppy Range Around the 200-Day — Price oscillates between the SMA200D support (about $405–$415) and resistance near $490 as the trend strength fades. Trigger: ADX rolls over below 20 with price holding the $405–$490 band. Target: $430–$470. Invalidation: close outside the $404–$520 band. (20% probability)
PRICE TARGETS
- Target Price: $418.00 (55-day horizon, about -6.9% from $449.04)
- Expected Range: $380.00 to $462.00 (width $82, about 18.3% of current price, consistent with the 30–60 day guidance of 12–18%)
- Key Levels: Support at $415.00 (SMA200D / VWAP confluence, with the $404.40 swing low just below), Resistance at $488.78 (the Nov 4 close, with the EMA21 at $519.15 behind it)
OVERALL BIAS
OVERALL BIAS: BEARISH - Price is below the EMA21, EMA55 and SMA50D after a bearish EMA crossover, with RSI at 38, MACD below signal and widening, CMF at -0.17, and -DI (38) dominating +DI (15) with ADX above 25. The main risk is the SMA200D/VWAP support near $415. A loss of that level would open $380 and lower, while a bounce is likely to stall at the $488–$520 resistance zone.
This is educational analysis and not financial advice.