DELL 55-day bearish forecast — Nov 8, 2026
- Bias: Bearish
- Timeframe: 55 days (made Nov 8, 2026, target date Jan 1, 2027)
- Price at analysis: $328.53
- Price target: $306.00
- Expected range: $280.00 – $340.00
- Result: Pending — graded after the close on Jan 1, 2027
Get a free AI analysis of DELL today
Analysis
TECHNICAL INDICATORS
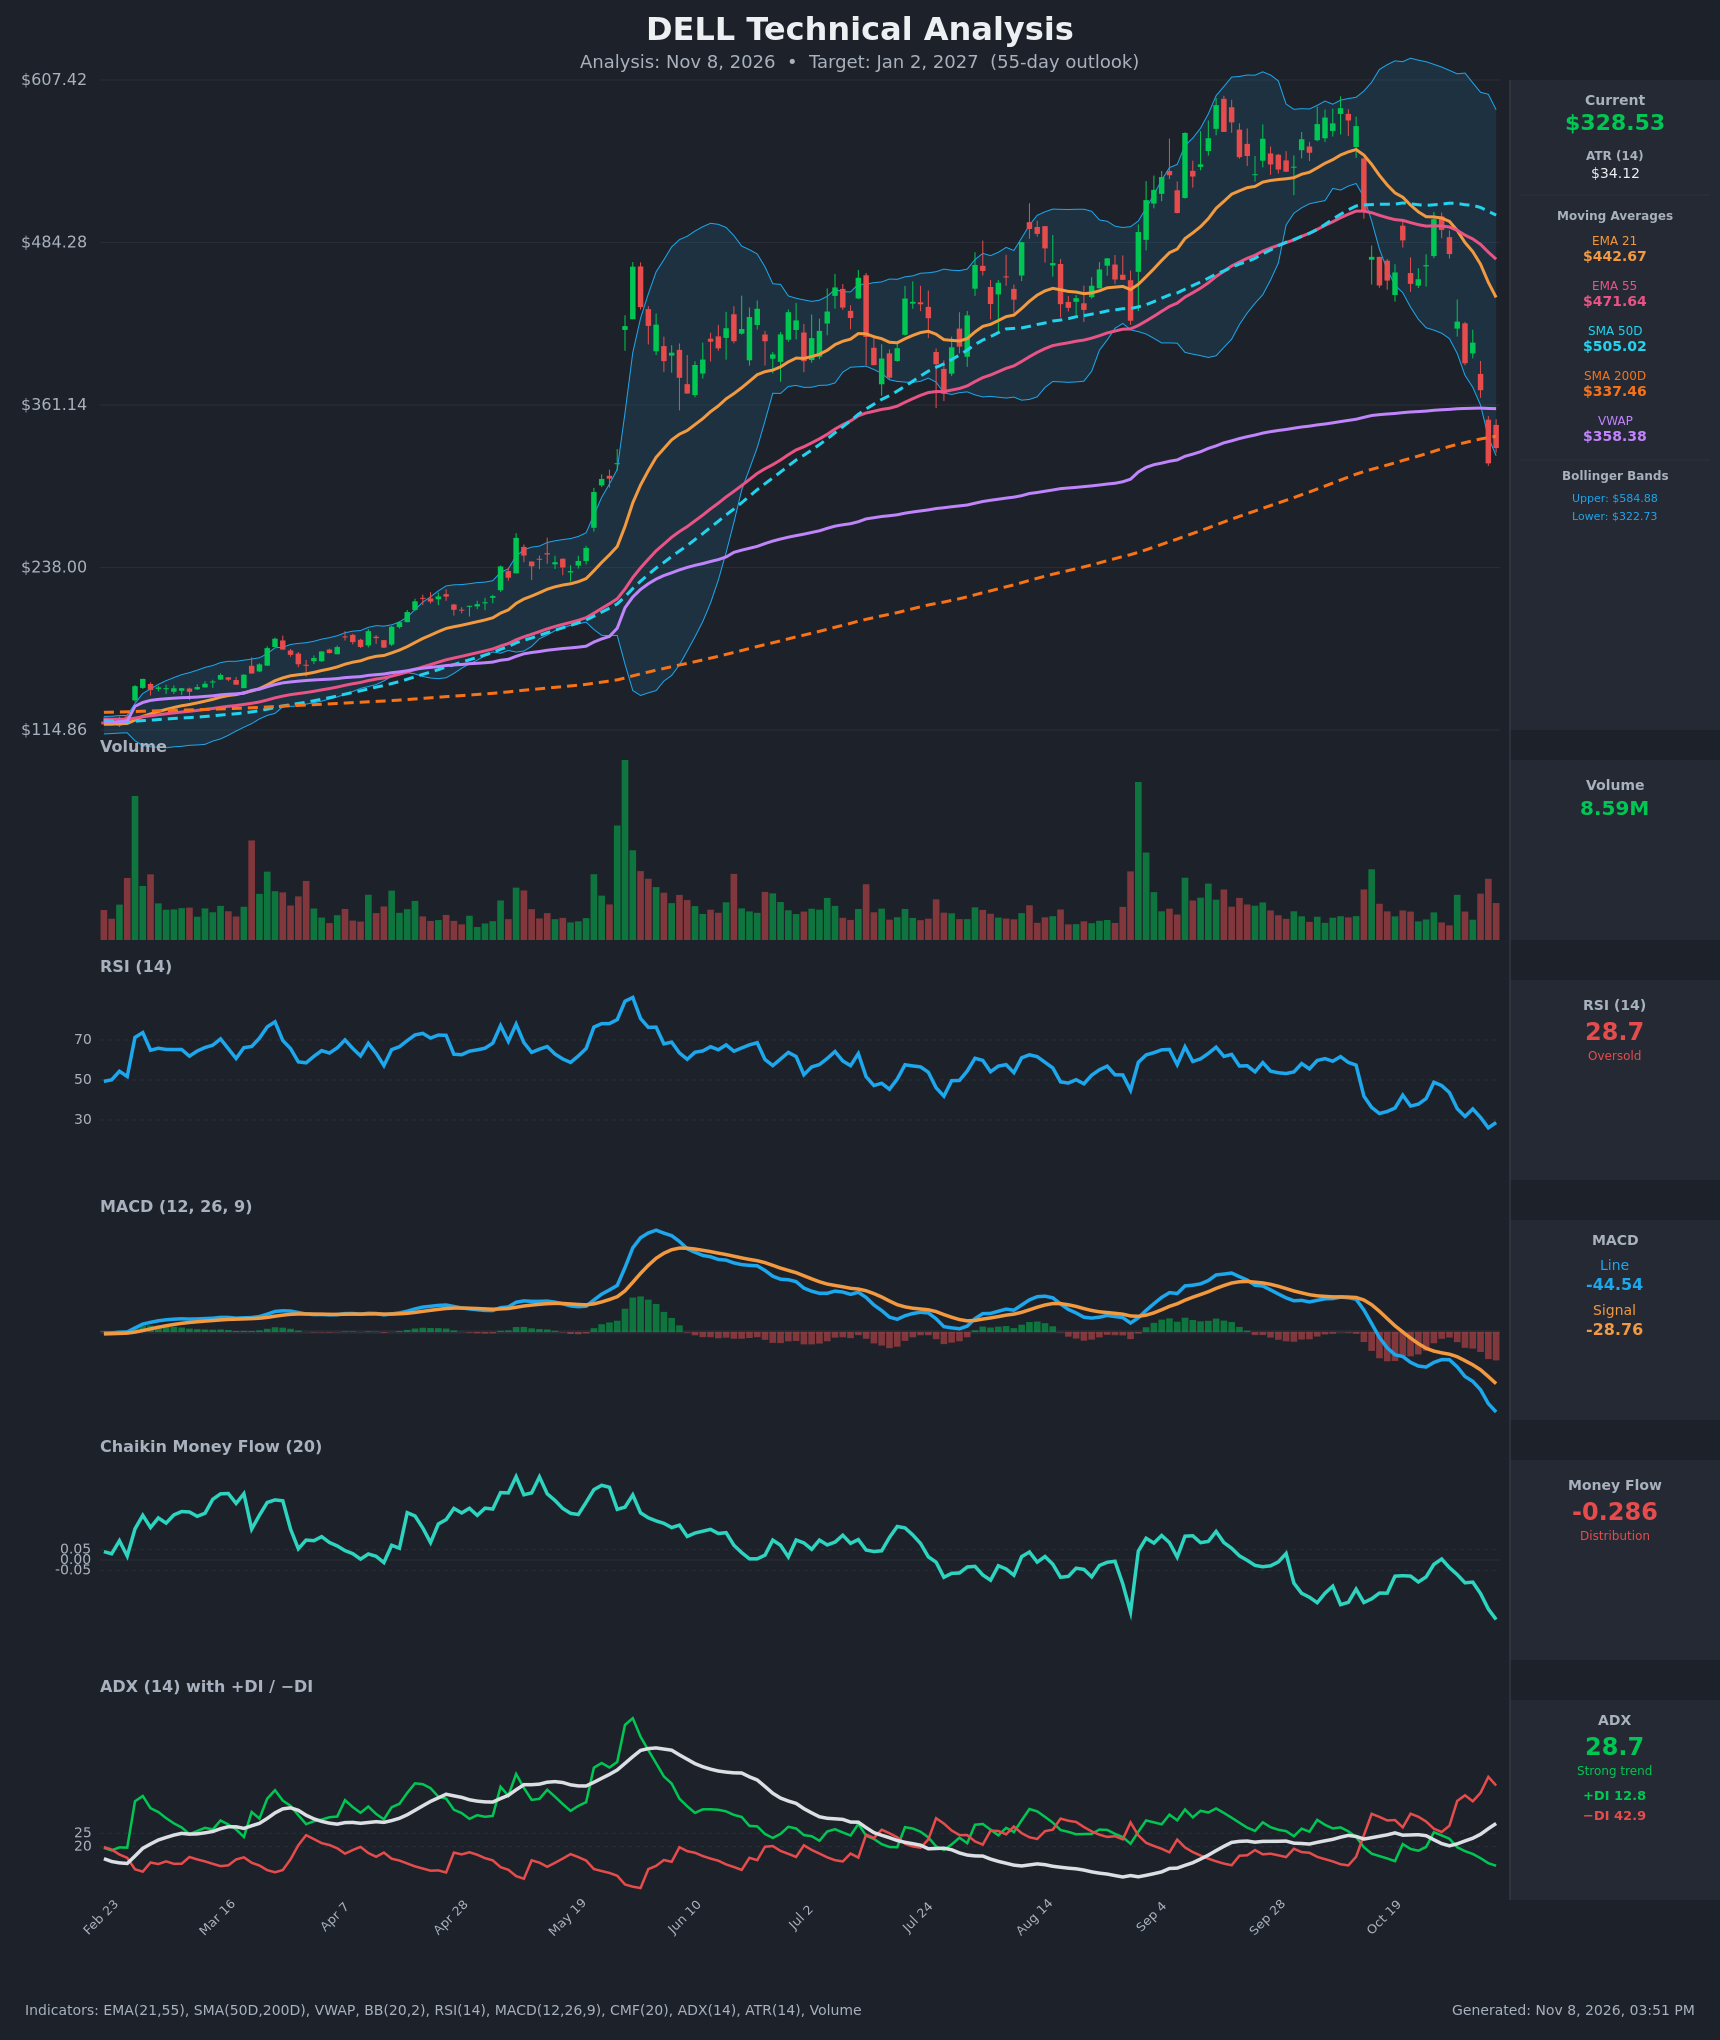
- RSI (14): 28.74, in oversold territory after falling from 48.9 on Oct 27. It made a lower low (26.1 on Nov 5) and is only ticking up slightly. Oversold readings in a strong downtrend can persist, though a bounce becomes more likely. [Bearish]
- 20 EMA: The chart uses EMA 21 at $442.67 and EMA 55 at $471.64. Price at $328.53 is about 26% below the EMA 21, and both EMAs are sloping down. EMA 21 crossed below EMA 55 around Oct 30 (a bearish cross), so both now act as overhead resistance. [Bearish]
- MACD: The line (-44.54) is well below the signal (-28.76), and the histogram is widening negative at about -15.8. The bearish crossover happened around Oct 22 and momentum is still accelerating down, with no sign of a bottom. [Bearish]
- Bollinger Bands (20): The bands are wide, with the upper at $584.88 and the lower at $322.73. Price sits just above the lower band after a band-walk and a sharp expansion. This is an extreme and often exhaustion-prone reading, but not yet a reversal signal. [Bearish]
- CMF (20): -0.286, deep in distribution (below -0.05). It has trended down from -0.075 in late October, which shows persistent heavy selling pressure. [Distribution]
- ADX (14): 28.7 and rising, so the trend is strong. −DI at 42.9 is far above +DI at 12.8, which means sellers are firmly in control. [Strong Trend – Bearish]
- Volume: 8.59M, elevated on the latest down bar relative to the prior weeks' average. The heavy sell-off volume points to forced or capitulative selling. It could mark a near-term low, but there is no volume-confirmed reversal yet. [Bearish / possible capitulation]
DIVERGENCES & TRENDS
- There is no bullish RSI or MACD divergence. RSI and MACD both made new lows alongside price, so momentum confirms the decline.
- Price fell from about $590 (September) to $328.53, roughly a 45% drop. The sharpest leg was Nov 5, when price fell from $372 to $317 (-15%).
- Price has broken below the VWAP ($358.38), EMA 21 and EMA 55, and the SMA 50 ($505.02). It is testing the SMA 200 ($337.46), and the Nov 6 close is slightly below it.
- EMA 21 is below EMA 55, a bearish cross. SMA 50 is still far above SMA 200 (about $168 apart), so there is no death cross yet. A cross is unlikely within 55 days unless the SMA 50 keeps falling fast.
- MACD, CMF, ADX and −DI all deteriorated together over the last 8 sessions, which shows broad trend alignment.
- The chart shows a lower high in late October (about $500 versus the $590 peak), then a break of the prior $400–$420 support zone. That confirms a trend change from up to down.
CHART PATTERNS
- The chart most resembles a Bearish Rising Wedge / double-top-style reversal at the September–October highs. Price made a lower high near $500 after the $590 peak, then broke down through the 50-day average and the former $400 support zone.
- The measured move from the distribution top, about $590 down to $400, projects a further drop of roughly $190. That points toward the $210–$250 region over a longer horizon, but that is beyond the 55-day horizon here.
- The Nov 5 breakdown candle through the 200-day SMA is a bearish continuation signal. Failure to reclaim $337–$358 would confirm it.
- A bullish counter-pattern is not yet present, since there is no falling wedge or double bottom. Price is only extended below the lower Bollinger Band area.
POTENTIAL SCENARIOS
- Scenario 1: Bearish Trend Continuation — The sell-off continues with a weak, shallow bounce that fails at the SMA 200 and VWAP, and price grinds lower through year-end. Trigger: a daily close below $316.91 (the Nov 5 low), with −DI staying above 40 and CMF staying below -0.1. Target: $285–$306, with an extension to about $270. Invalidation: a daily close above $358 (VWAP) with RSI back above 50. (50% probability)
- Scenario 2: Bullish Oversold Relief Bounce — RSI near 28, the lower Bollinger Band and the SMA 200 produce a capitulation low, and price squeezes back toward the VWAP and the underside of the 21 EMA. Trigger: a reclaim of $337.46 on rising volume and an MACD histogram that stops falling. Target: $358–$385 (VWAP, then the broken $380 zone). Invalidation: a close below $316.91. (35% probability)
- Scenario 3: Neutral Basing Range — Price stabilizes after the shock and chops between about $300 and $345 while indicators reset. Trigger: ADX turns lower while price holds above $316. Target: $315–$340. Invalidation: a break of $300 or a close above $358. (15% probability)
PRICE TARGETS
Timeframe: 55 days (target date Jan 2, 2027). Range width check: $340.00 − $280.00 = $60.00, which is 18.3% of the $328.53 price. That is consistent with the 30–60 day guidance of 12–18% (slightly wider given the 10% ATR).
- Target Price: $306.00 (for the exact 55-day timeframe)
- Expected Range: $280.00 to $340.00
- Key Levels: Support at $316.91, Resistance at $337.46
OVERALL BIAS
OVERALL BIAS: BEARISH - The trend indicators all agree: ADX is 28.7 with −DI at 42.9, MACD is widening negative, CMF is at -0.286, and price is below every key moving average except the SMA 200, which it is testing. The oversold RSI raises the odds of a relief bounce, but the 50% bearish scenario still outweighs the 35% bounce scenario.
This is educational analysis and not financial advice.