F 55-day bullish forecast — Nov 8, 2026
- Bias: Bullish
- Timeframe: 55 days (made Nov 8, 2026, target date Jan 1, 2027)
- Price at analysis: $12.44
- Price target: $12.95
- Expected range: $11.70 – $13.55
- Result: Pending — graded after the close on Jan 1, 2027
Get a free AI analysis of F today
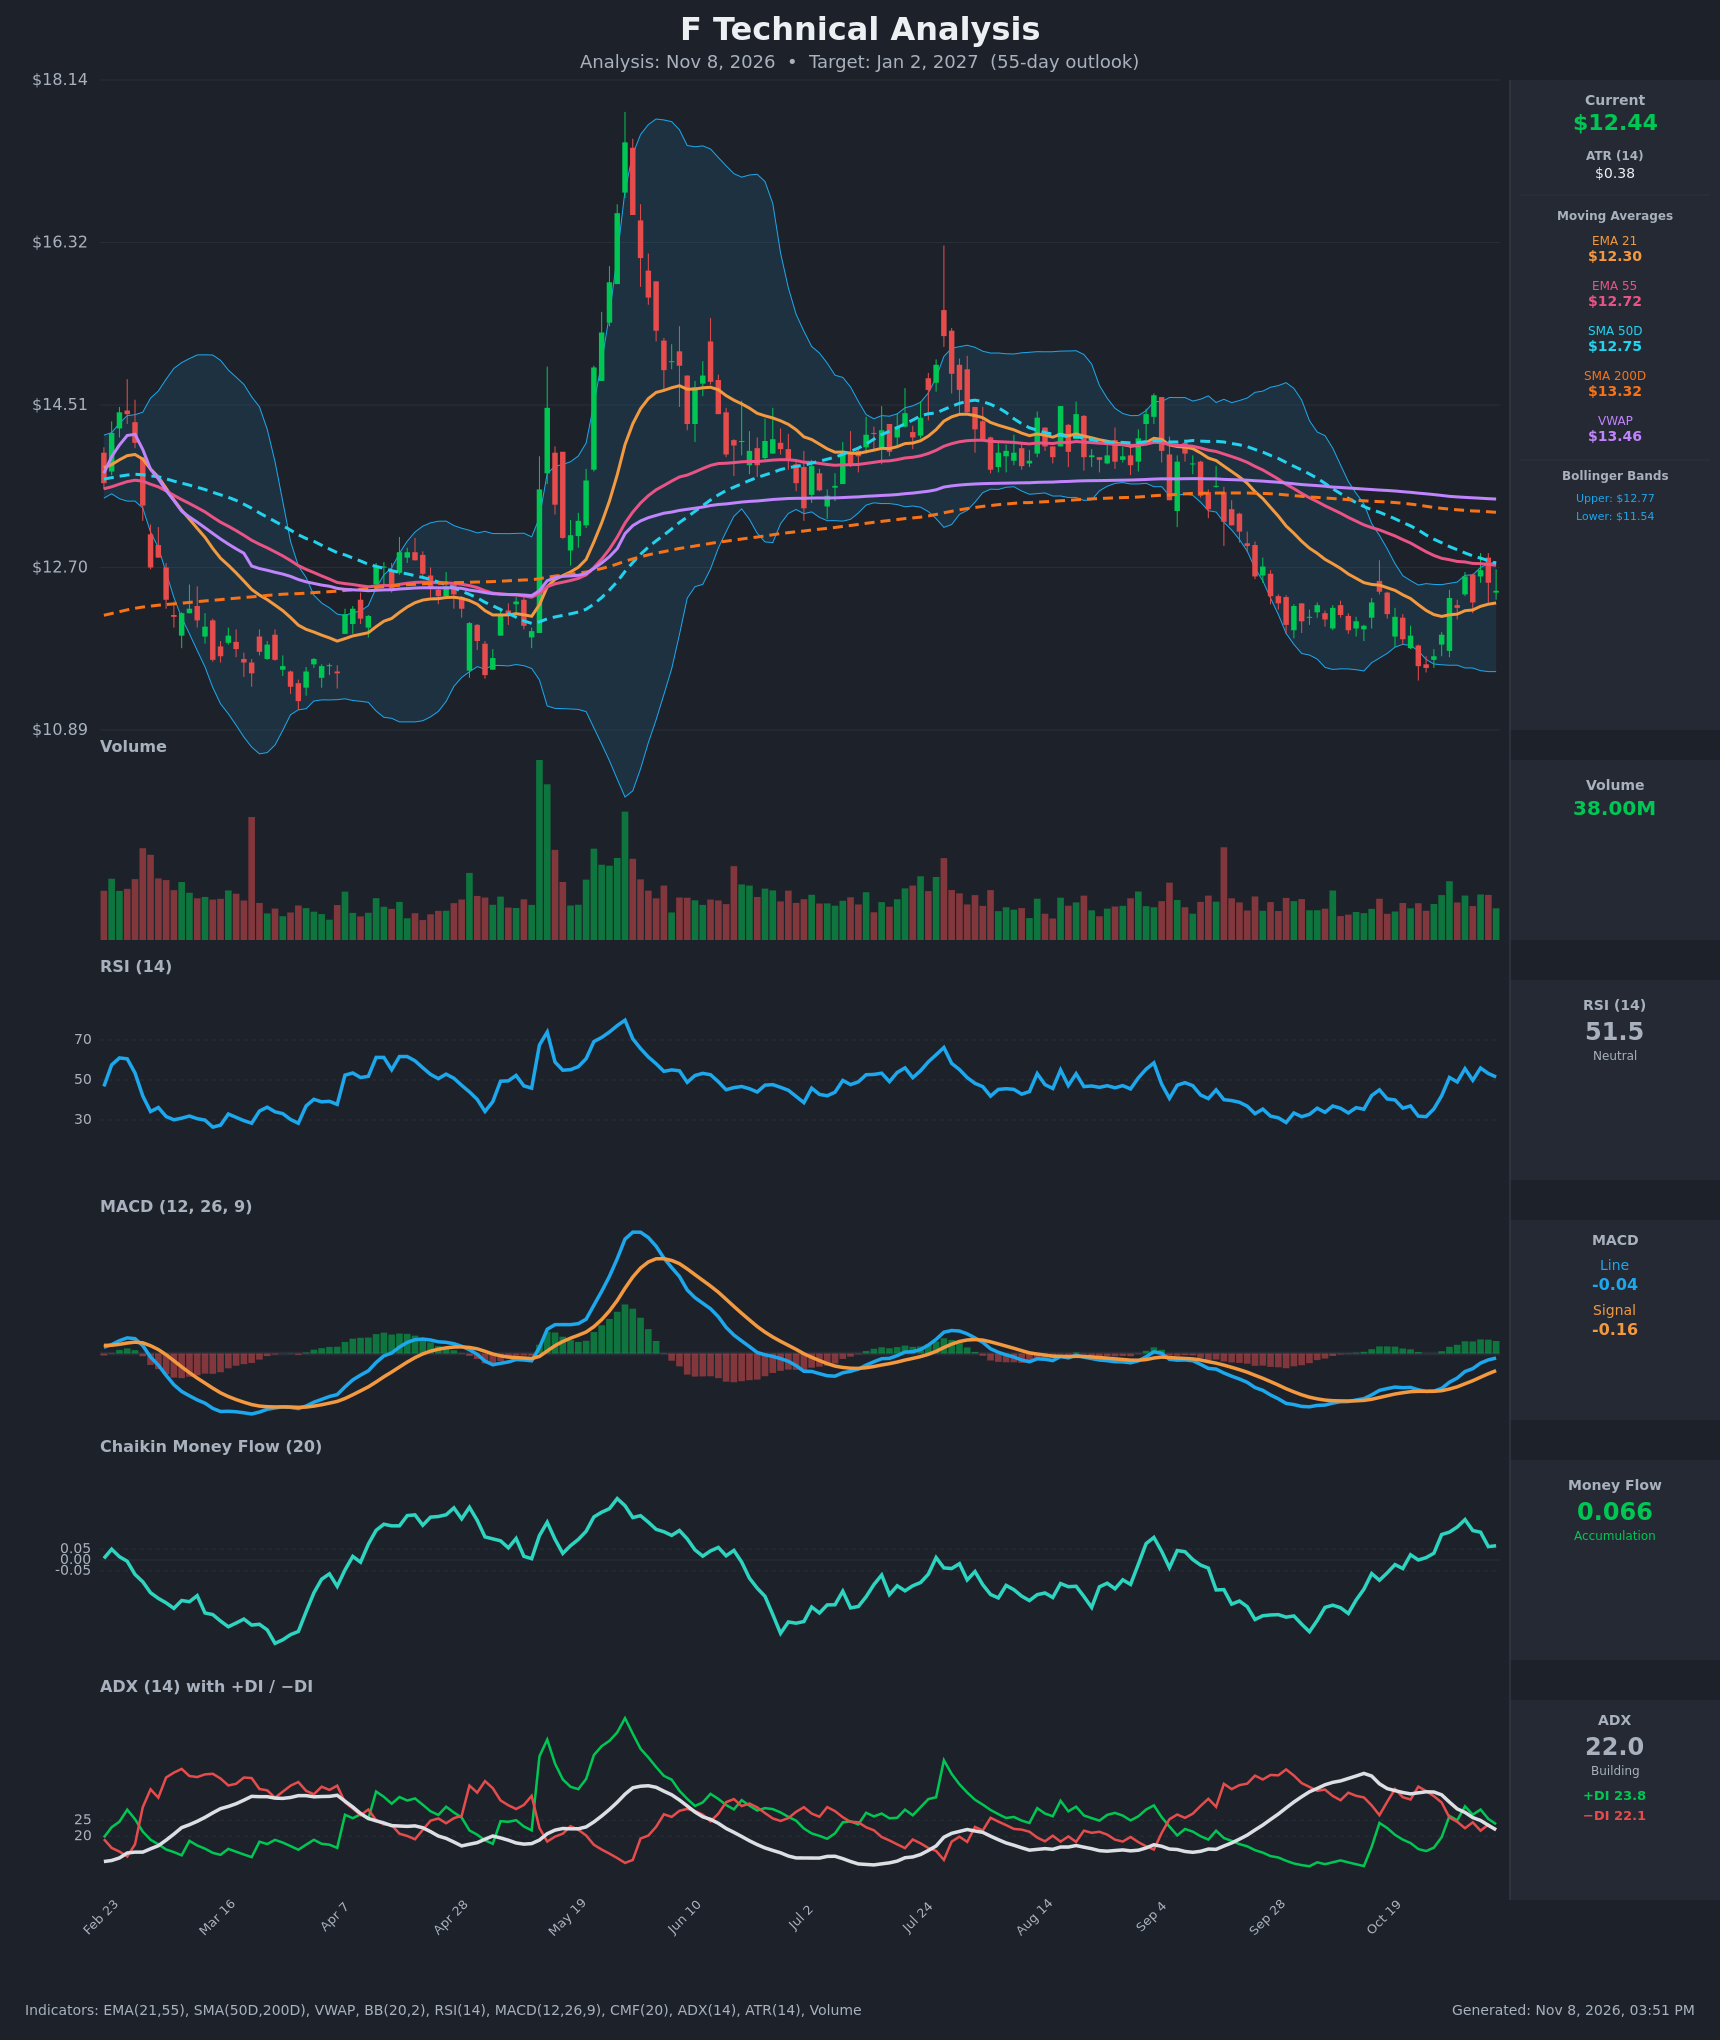
Analysis
TECHNICAL INDICATORS
- RSI (14): 51.53, mid-range and neutral. It has recovered from an oversold 31.7 on Oct 26 and peaked near 56 on Nov 4. It has flattened slightly over the last three sessions, so the momentum thrust is fading but not reversing. [Neutral]
- 20 EMA: The 21 EMA is $12.30 and price ($12.44) is above it, so it acts as near-term support. The EMA21 has turned up after bottoming around $12.15. Price is still below the EMA55 ($12.72), which has not been reclaimed. [Bullish]
- MACD: The line is -0.041 against a signal of -0.156, so the histogram is positive (+0.115) and has been rising for about 8 sessions. The bullish crossover occurred on Oct 26-27, and the line is approaching the zero line. The line is still below zero, so this is an early-stage recovery rather than a confirmed trend change. [Bullish]
- Bollinger Bands (20): Upper is $12.77, lower is $11.54, and the midline is about $12.15. Price sits in the upper half of the bands after bouncing off the lower band in late October. The bands are narrow relative to the spring volatility, which points to modest expansion ahead. Resistance at the upper band coincides with the EMA55/SMA50 cluster. [Neutral]
- CMF (20): 0.066, above +0.05, and it has been positive since Oct 22. It dipped from a 0.186 peak on Nov 2, but buyers still hold the edge. Accumulation is modest and not yet strong. [Accumulation]
- ADX (14): 22.0 and falling from 34.9 on Oct 19, with +DI 23.8 just above −DI 22.1. The DIs crossed bullishly on Oct 29, but the spread is thin. The prior bearish trend has exhausted and there is no strong new trend. [Weak Trend, slight bullish lean]
- Volume: 38.00M, in line with the recent average. There is no strong volume expansion on the bounce, and volume has been slightly higher on the up days in the last two weeks. [Neutral-to-mildly bullish]
DIVERGENCES & TRENDS
- RSI divergence: Price made a lower low in late October, but RSI bottomed near 31.7 and had not made a new low. It then rose to 56, which is mild bullish confirmation.
- MACD: The bullish crossover is intact and the histogram is expanding. The line is approaching zero, and a cross above zero would confirm the shift in momentum.
- Moving averages: A death cross (SMA50 below SMA200) is in place, with SMA50 at $12.75 against SMA200 at $13.32. Price is below SMA200 and VWAP ($13.46), so the long-term trend is still down and the bounce is counter-trend until $12.75 is reclaimed.
- EMA/SMA convergence: EMA21 is rising toward the EMA55 ($12.72), and the gap has narrowed from about $0.60 to about $0.42. A bullish EMA21/EMA55 cross is plausible within weeks if price holds.
- Directional indicators: ADX has fallen from the mid-30s as the selloff exhausted itself. The DI crossover is fresh but marginal.
- CMF: It improved from negative in September to positive in late October, so money flow turned before price did.
CHART PATTERNS
- Bullish Double Bottom / Falling Wedge (reversal): The September-October decline from about $14.5 to $11.4 looks like a falling-wedge style decline. The late-October lows near $11.4-11.6 and the sharp bounce resemble a double bottom with a neckline near $12.6-12.75. The measured move from a roughly $11.5 base to a $12.7 neckline is about $1.20, projecting to about $13.9. That is the full extension, and the $13.3-13.5 resistance zone makes it a stretch target.
- Resistance confluence: The EMA55 ($12.72), SMA50 ($12.75) and upper Bollinger Band ($12.77) all sit within about $0.05. This is a strong overhead barrier that price must close above to confirm the pattern.
- Next hurdle: SMA200 ($13.32) and VWAP ($13.46) form the next ceiling, which matches the earlier September breakdown area.
POTENTIAL SCENARIOS
- Scenario 1: Bullish Reversal Breakout — Price clears the $12.75 confluence and the double-bottom neckline, then grinds toward the SMA200 and VWAP zone as MACD crosses above zero and the EMA21/55 cross occurs. Trigger: daily close above $12.78 on above-average volume. Target: $13.30-$13.50 by early January 2027, with a stretch to $13.9. Invalidation: close below $12.00. (45% probability)
- Scenario 2: Neutral Range Chop — Price fails at the $12.75 cluster but holds above the EMA21 and the $11.9 lows, oscillating between about $12.00 and $12.80 as ADX stays below 20. Trigger: repeated rejection at $12.75 with weak volume. Target: $12.20-$12.70. Invalidation: close above $12.80 or below $11.90. (25% probability)
- Scenario 3: Bearish Failed Bounce — The rally stalls at the EMA55/SMA50/upper-band cluster and fades with the death cross intact. MACD rolls over below the signal and price revisits the October lows. Trigger: close below $12.30 (EMA21) and then $12.00. Target: $11.50-$11.70. Invalidation: close above $12.85. (30% probability)
PRICE TARGETS
Timeframe: 55 days (target date about Jan 2, 2027).
- Target Price: $12.95. This is a modest gain of about 4%, since SMA200/VWAP overhead resistance limits the upside.
- Expected Range: $11.70 to $13.55. The width is $1.85, about 14.9% of the current price, which fits the 12-18% guidance for a 30-60 day window.
- Key Levels: Support at $12.30 (EMA21), Resistance at $12.75 (SMA50/EMA55 cluster, followed by $13.32 SMA200).
OVERALL BIAS
OVERALL BIAS: BULLISH - The MACD bullish crossover with a rising histogram, positive CMF accumulation, a fresh +DI/−DI cross and an RSI bounce from oversold support a recovery toward the $13 area. Conviction is modest because price remains below the SMA50, SMA200 and VWAP, and the $12.75 resistance cluster must be reclaimed first.
This is educational analysis and not financial advice.