HOOD 55-day bearish forecast — Nov 8, 2026
- Bias: Bearish
- Timeframe: 55 days (made Nov 8, 2026, target date Jan 1, 2027)
- Price at analysis: $80.91
- Price target: $74.00
- Expected range: $64.00 – $90.00
- Result: Pending — graded after the close on Jan 1, 2027
Get a free AI analysis of HOOD today
Analysis
TECHNICAL INDICATORS
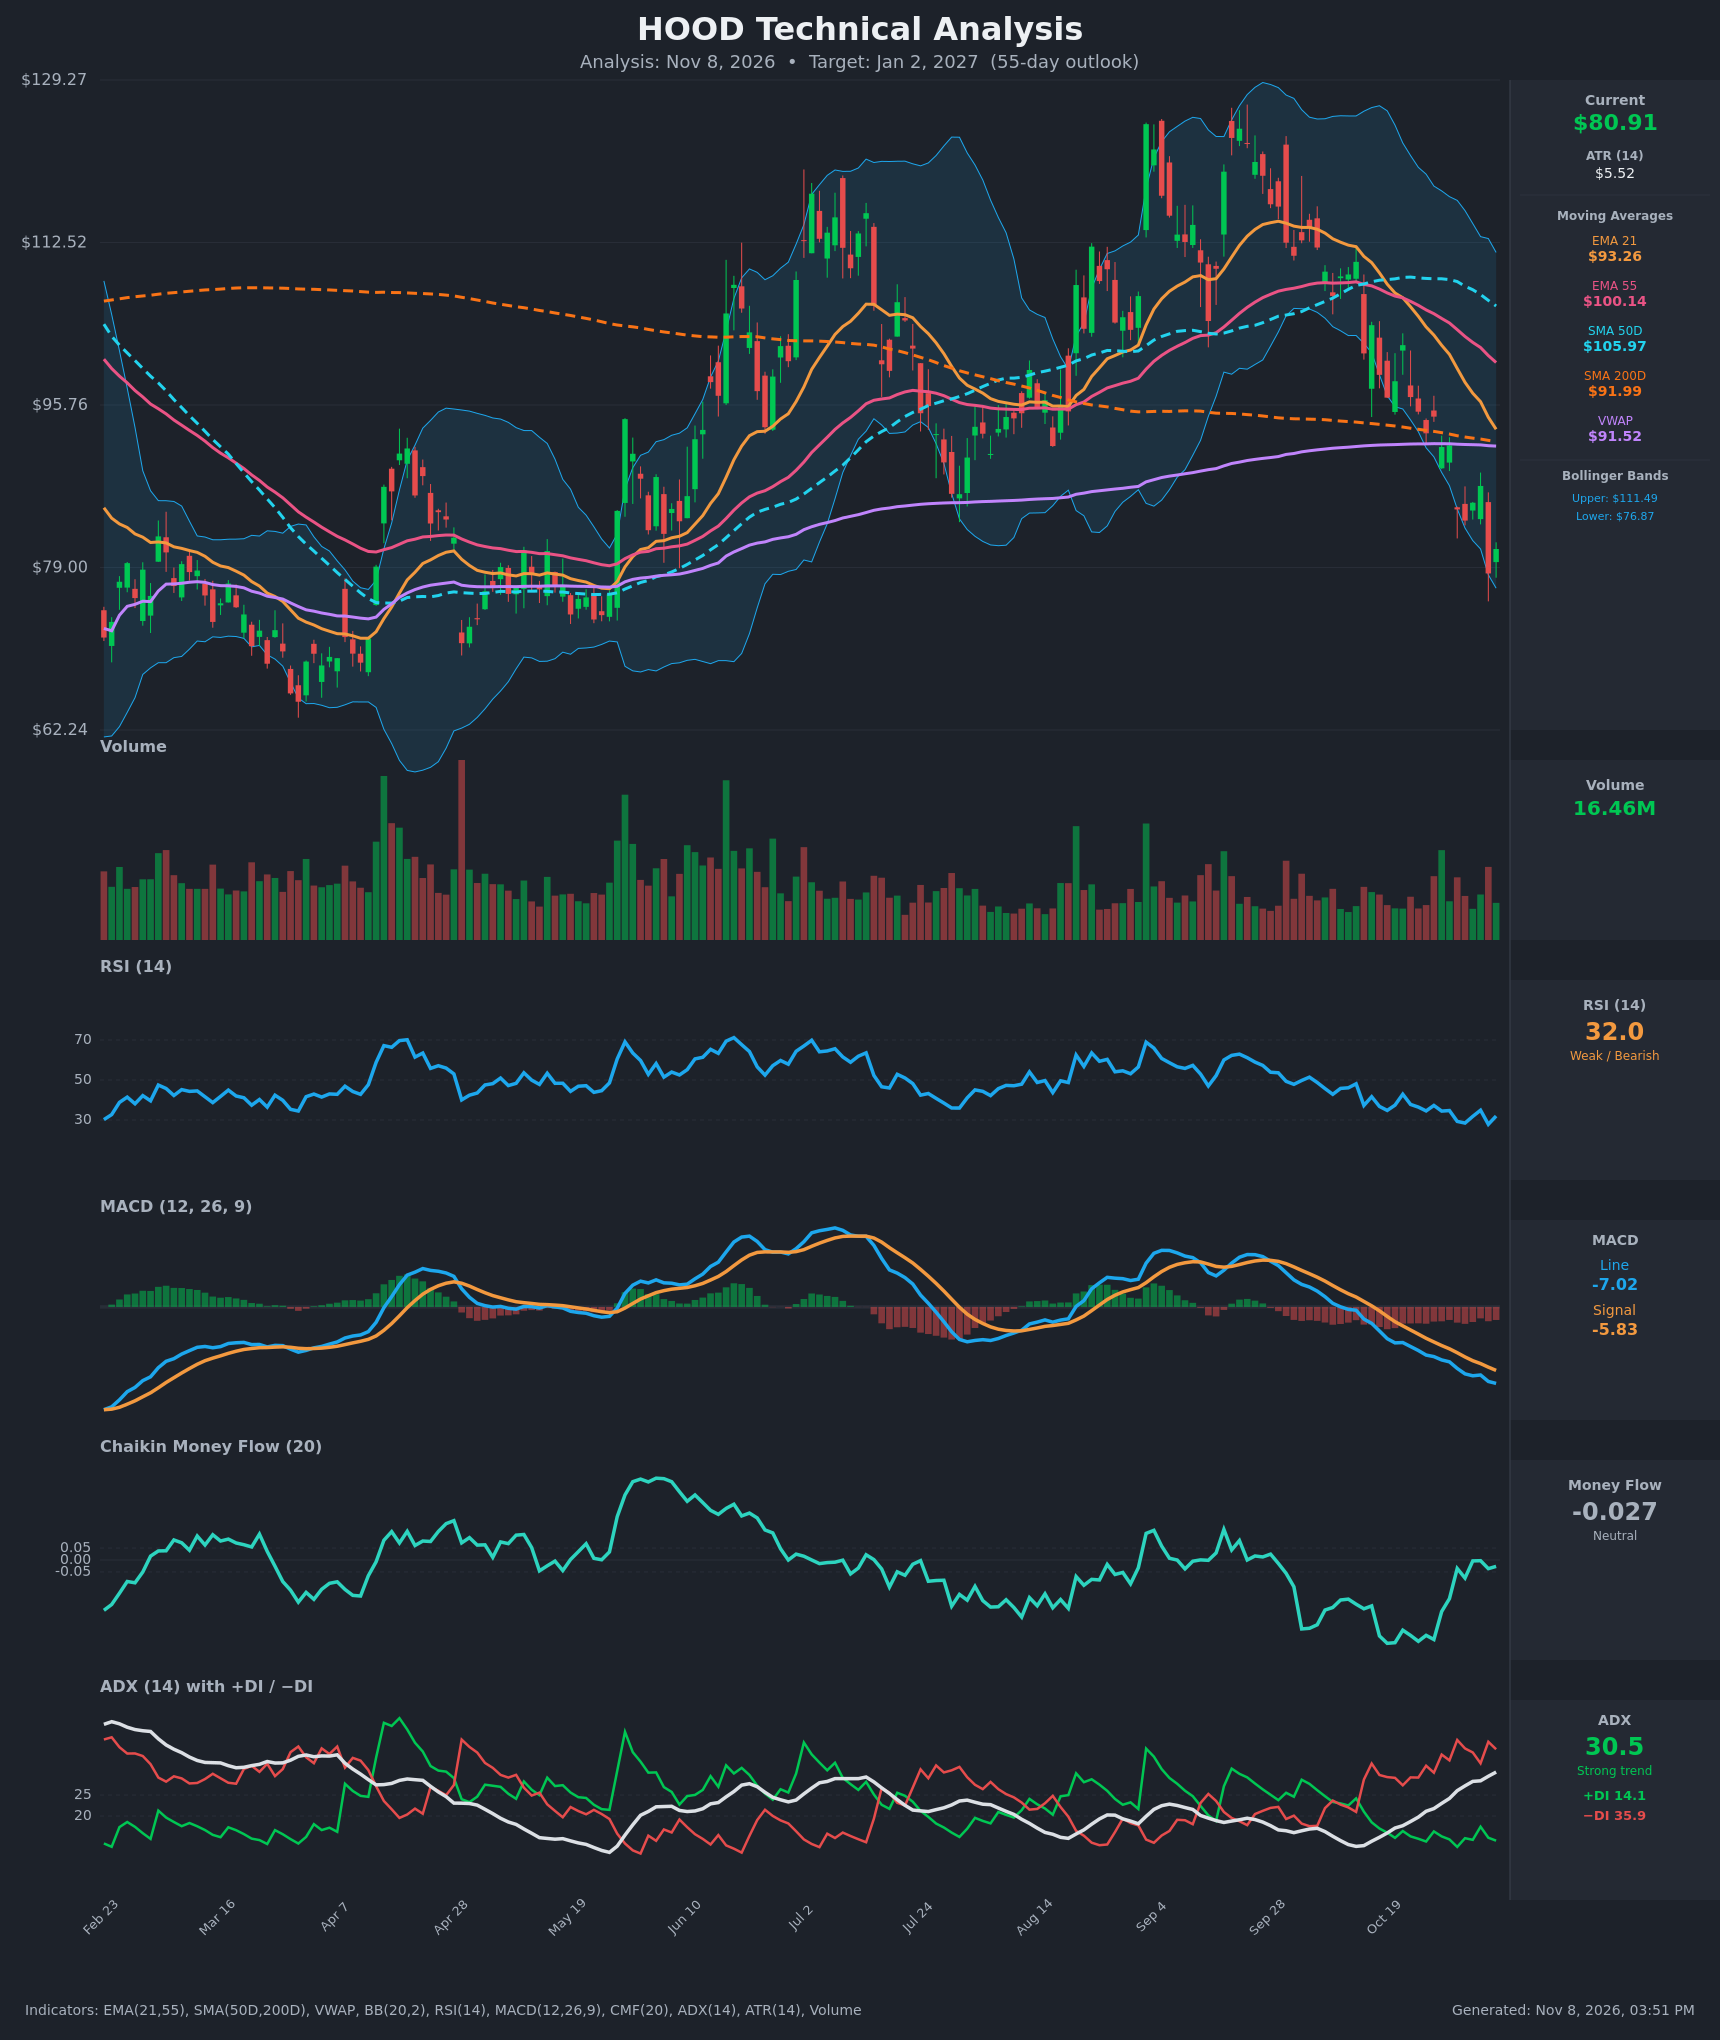
- RSI (14): 31.97, just above oversold. It has trended down from the 50s in early October and has made lower lows at 28-29. It has been stuck in the 28-37 zone for three weeks, which shows persistent selling and no bullish reversal yet. [Bearish]
- 20 EMA (EMA 21): $93.26, with price at $80.91 about 13% below it. EMA 21 is below EMA 55 ($100.14) and falling steeply, so it acts as overhead resistance. [Bearish]
- MACD: Line -7.02 is below Signal -5.83, and the gap has widened for 15 straight bars. The histogram is negative and expanding, and both lines are well below zero. [Bearish]
- Bollinger Bands (20): Upper $111.49, lower $76.87. Price at $80.91 is in the lower quarter of the band after riding the lower band and tagging it on the Nov 5 flush to $78.39. The bands are wide, so volatility is high. Walking the band in a downtrend is bearish, though it raises the odds of a short-term bounce. [Bearish]
- CMF (20): -0.027, which is neutral. It has recovered from about -0.35 in mid-October to near zero, so selling pressure has eased even though price kept falling. It is not showing accumulation. [Neutral]
- ADX (14): 30.5 and rising, up from 16 on Oct 19. −DI is 35.9 against +DI 14.1, a very wide gap. This is a strong, established downtrend with the bears fully in control. [Strong Trend – Bearish]
- Volume: 16.46M on the latest bar, which is moderate. The recent large red candles (Oct 30, Nov 5) came on above-average volume, so the selling is real. The bounce on Nov 6 has light volume and little conviction. [Bearish – distribution on down days]
DIVERGENCES & TRENDS
- Moving average structure: SMA50D ($105.97) is above SMA200D ($91.99), so there is no death cross yet. It is being approached, though, because SMA50D is falling about $0.5 per day while SMA200D is flat to slightly down. A death cross could form within the 55-day window.
- EMA 21 / EMA 55: EMA 21 crossed below EMA 55 around Oct 21 (106.82 vs 106.81) and the gap has widened to about $7. This is a confirmed bearish crossover.
- Price vs SMA200D: Price has broken below SMA200D ($91.99) and is about 12% under it. That is a long-term bearish signal, and the SMA200D is now overhead resistance.
- MACD: It crossed bearishly in mid-October and is still accelerating lower with no sign of flattening.
- Possible bullish divergence (CMF): CMF has improved from -0.35 to about -0.03 while price made lower lows. This suggests selling pressure is exhausting. RSI has not made a clear bullish divergence, since its lows of 28.5 and 27.8 were similar.
- Price vs VWAP: Price is about 11.6% below VWAP ($91.52), so rallies toward it will likely meet supply.
- Prior support: The $76-79 zone held in April-June and sits near the lower Bollinger Band. This is the key support, and a break below it opens the $62-70 area.
CHART PATTERNS
- Bearish head and shoulders / topping structure: The chart shows a major top, with the peak near $125-129 in September, followed by lower highs and a sharp decline. The rally from $62 to $129 has now retraced about 75% of its range. It resembles the reference Bearish Head and Shoulders, with the neckline around $91-95 (the August-September lows and SMA200D) already broken.
- Measured move: Head at about $127 minus neckline at about $93 is about $34. A neckline break at $93 projects to roughly $59, which is below the April low near $62.
- Bearish continuation: The steady series of lower highs and lower lows since September fits a downtrend channel. Bounces to $87-92 would form a bearish flag or pennant if volume stays light.
- Support risk: The $76-79 zone is a multi-month base. A bounce there is likely, but a close below it would confirm the pattern's downside targets.
POTENTIAL SCENARIOS
- Scenario 1: Bearish Trend Continuation — The −DI-dominated trend (ADX 30.5 and rising) and bearish MACD and moving averages persist. Price relieves oversold conditions briefly, fails near $88-92 (SMA200D, VWAP and EMA 21 cluster), and then breaks the $76-79 support. Trigger: a daily close below $76.87 (lower Bollinger Band), or a rejection at $88-92. Target: $68-72, with an extreme low near $62-65. Invalidation: a daily close above $93 (EMA 21 and SMA200D). (50% probability)
- Scenario 2: Neutral/Bearish Base Building — Price holds $74-79, CMF improves, and a range forms between $76 and $90 as the oversold RSI resets. Trigger: RSI holds above 30 and MACD histogram stops expanding. Target: $78-88 range. Invalidation: a close below $74 or a close above $92. (30% probability)
- Scenario 3: Bullish Oversold Reversal — A sharp relief rally from the lower band, with a CMF bullish divergence. The price squeezes back to the EMA 21 and SMA200D cluster ($92-95). Trigger: a close above $88 on rising volume with a MACD histogram turn. Target: $93-97. Invalidation: failure to hold $78. (20% probability)
PRICE TARGETS
For a 55-day horizon, the range width should be about 12-18% of the current price, so I used about 20% to account for HOOD's elevated volatility (ATR $5.52, about 6.8% of price). The self-check is below.
- Target Price: $74.00
- Expected Range: $64.00 to $90.00 (width $26.00, about 32% of price. This is wider than the standard 12-18% guidance because HOOD's ATR is about 6.8% of price, so a 55-day move is expected to be large.)
- Key Levels: Support at $76.87 (lower Bollinger Band, with $62.24 as deeper support), Resistance at $91.99 (SMA200D, near VWAP $91.52 and EMA 21 $93.26)
OVERALL BIAS
OVERALL BIAS: BEARISH - Price is below all major moving averages including SMA200D. MACD is accelerating lower, ADX is above 30 with −DI dominating (35.9 vs 14.1), and the topping structure projects toward $60-70. An oversold bounce is likely along the way, but the weight of evidence favors lower prices over the next 55 days.
This is educational analysis and not financial advice.