IBM 55-day bearish forecast — Nov 8, 2026
- Bias: Bearish
- Timeframe: 55 days (made Nov 8, 2026, target date Jan 1, 2027)
- Price at analysis: $245.00
- Price target: $239.00
- Expected range: $222.00 – $262.00
- Result: Pending — graded after the close on Jan 1, 2027
Get a free AI analysis of IBM today
Analysis
TECHNICAL INDICATORS
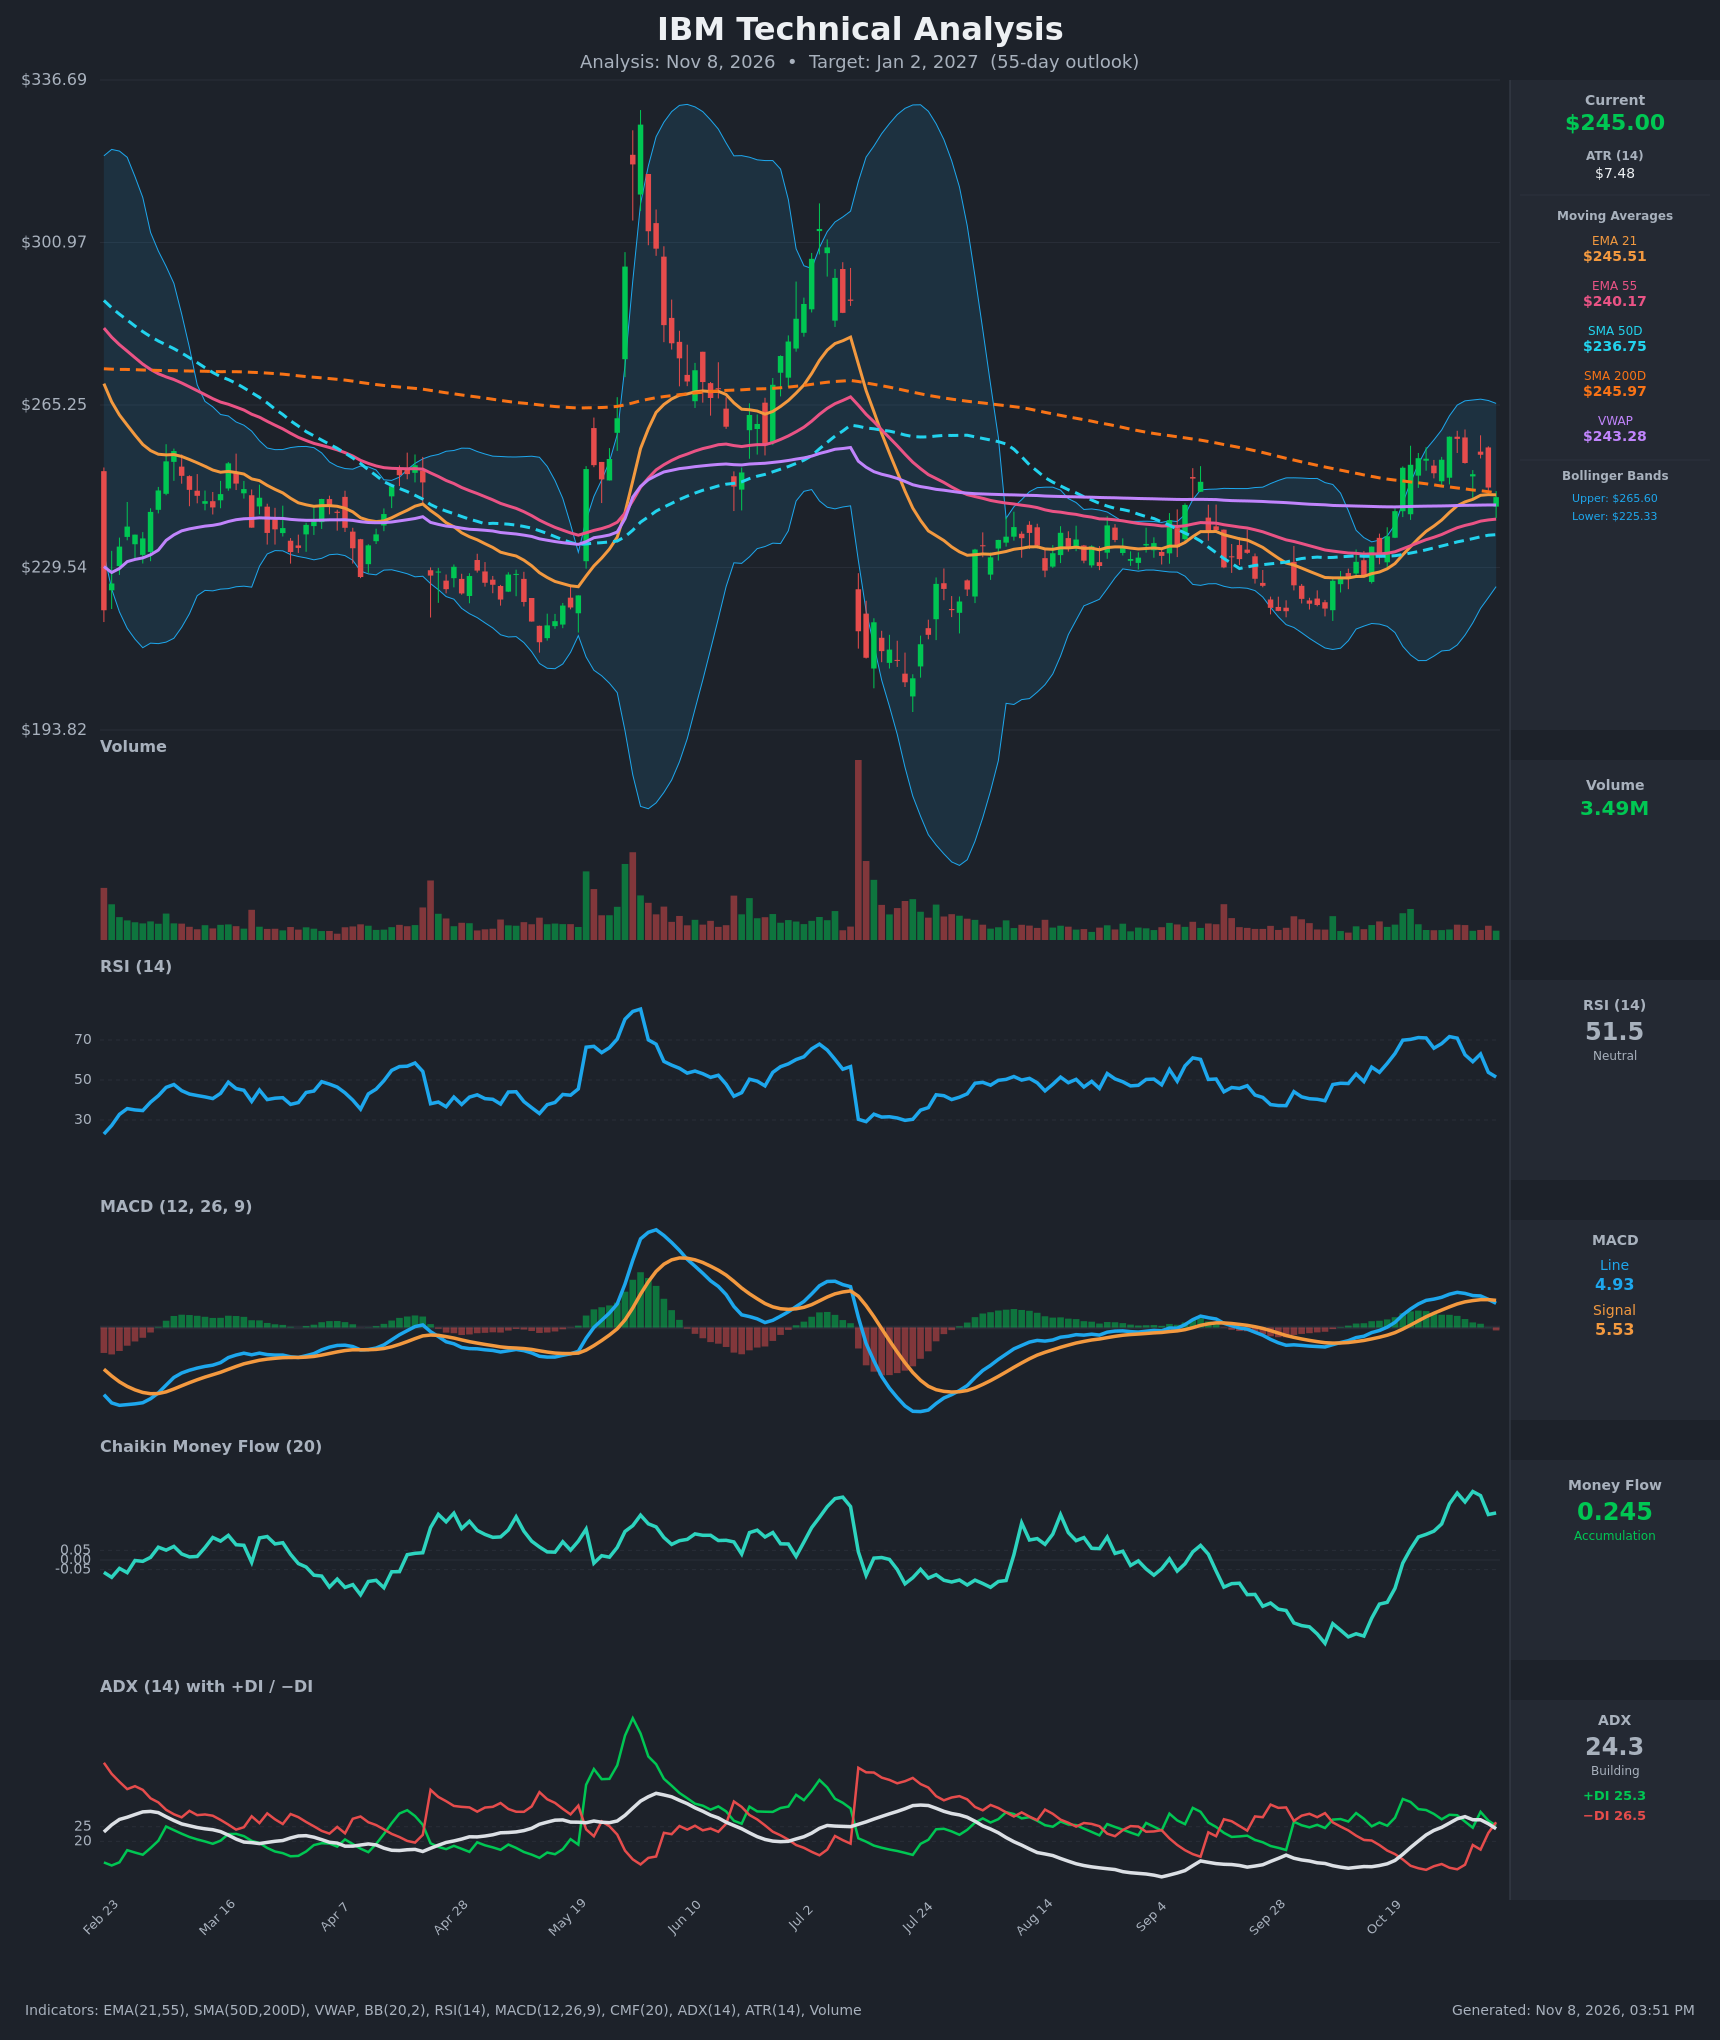
- RSI (14): 51.48, down sharply from about 71 on Oct 29-30 and now back at the midline. Momentum has rolled over, but the reading is not oversold and leaves room to fall further. [Bearish]
- 20 EMA (EMA 21): $245.51. Price at $245.00 has slipped just below it after holding above since Oct 30. The EMA21 is flattening and now acts as minor resistance. EMA55 ($240.17) sits below as the next support. [Neutral]
- MACD: Line 4.93 is below Signal 5.53, a bearish crossover on Nov 6 after the line peaked near 7.16. The histogram has turned negative and the line is falling. Momentum has clearly faded from the October rally. [Bearish]
- Bollinger Bands (20): Upper $265.60, lower $225.33, midline about $245.5. Price is sitting on the midline after being rejected near the upper half ($258). The bands are widening from a prior squeeze, so volatility is expanding, but there is no directional edge from the bands themselves. [Neutral]
- CMF (20): 0.245, well above +0.05 and the strongest reading in months. It has been positive for about 10 sessions, a clear accumulation footprint, though it is off its peak of about 0.357. [Accumulation]
- ADX (14): 24.3 and now falling from 28.4, just under the 25 trend threshold. −DI (26.5) has crossed above +DI (25.3), a fresh bearish DI crossover. The trend is weakening with a slight bearish tilt. [Weak Trend, bearish tilt]
- Volume: 3.49M, light and below the spikes seen on the big May and July moves. The recent pullback is on unremarkable volume, so there is no panic selling, but also no strong buying conviction. [Neutral]
DIVERGENCES & TRENDS
- Price made a higher high at $258.28 (Oct 29), while RSI topped at 71.7 and MACD kept rising for a few more days. There was no classic divergence, but the subsequent drop in RSI from 71 to 51 in six sessions shows rapid momentum loss.
- Crossovers: MACD bearish cross (Nov 6) and −DI over +DI (Nov 6). EMA21 is converging with price and the SMA200 at $245.97.
- Moving averages: EMA21 > EMA55 > SMA50D, a short-term bullish stack. Price is right at the SMA200 ($245.97), which has capped price repeatedly, so this is a decision zone. SMA50D ($236.75) is rising toward the falling SMA200, and a golden cross is mathematically possible in the next 2-4 weeks. It would be a lagging signal.
- CMF vs price: CMF is bullish while momentum indicators turn bearish, which is the main conflicting signal.
- The broader structure since August is a $220-$260 range, with price at the middle-to-upper part of it.
CHART PATTERNS
- Bearish Head and Shoulders / Triple Top (loose): Peaks at about $253.5 (Oct 23), $258.3 (Oct 29) and $254.3 (Nov 4) form a rough head-and-shoulders with a neckline around $250. Price has closed below that neckline ($247, $245). The measured move (head $258 minus neckline $250 = about $8) points to roughly $242, near the EMA55/SMA50 cluster. The pattern is small and not perfectly formed, so confidence is moderate.
- Larger range: Price is oscillating in a $220-$260 base. A breakdown from this small top most likely retests the $237-$240 support rather than the range low.
- The bullish counter-case is a failed breakdown, with price reclaiming the SMA200 and neckline and resuming toward $258-$265.
POTENTIAL SCENARIOS
- Scenario 1: Bearish Neckline Breakdown and Pullback to MA Support — Rejection at the SMA200/EMA21 confluence, with MACD and DI both bearish, leads to a drift lower toward the EMA55/SMA50 zone. Price may undercut it briefly before stabilizing. Trigger: daily close below $243 and then below $240.17. Target: $236-$240, with an extension to $228-$230 if the SMA50 fails. Invalidation: daily close above $254.30. (50% probability)
- Scenario 2: Bullish Reclaim and Trend Continuation — Strong CMF accumulation and a possible SMA50/SMA200 golden cross support a reclaim of the SMA200 and a retest of the October highs. Trigger: close above $248 with MACD recrossing above its signal. Target: $258-$265 (upper Bollinger Band). Invalidation: close below $236.75. (30% probability)
- Scenario 3: Neutral Range Chop — Price oscillates between the $236 SMA50 and the $254 lower high, with ADX staying below 25. Trigger: ADX falling below 20 with no clean break. Target: $240-$250. Invalidation: close outside $234-$256. (20% probability)
PRICE TARGETS
For the 55-day horizon (to about Jan 2, 2027):
- Target Price: $239.00
- Expected Range: $222.00 to $262.00 (width $40, about 16.3% of current price, consistent with the 12-18% guidance for 30-60 days)
- Key Levels: Support at $240.17 (EMA55; then $236.75 SMA50), Resistance at $254.30 (recent lower high; then $258.28 swing high)
OVERALL BIAS
OVERALL BIAS: BEARISH - Price is stalling at the SMA200/EMA21 confluence after a fast RSI drop from 71 to 51. MACD and DI have both crossed bearish, and the rough head-and-shoulders neckline near $250 has broken. This points to a pullback toward the $236-$240 support cluster, although strong CMF accumulation keeps conviction modest.
This is educational analysis and not financial advice.