MSFT 55-day bullish forecast — Nov 8, 2026
- Bias: Bullish
- Timeframe: 55 days (made Nov 8, 2026, target date Jan 1, 2027)
- Price at analysis: $530.61
- Price target: $545.00
- Expected range: $495.00 – $575.00
- Result: Pending — graded after the close on Jan 1, 2027
Get a free AI analysis of MSFT today
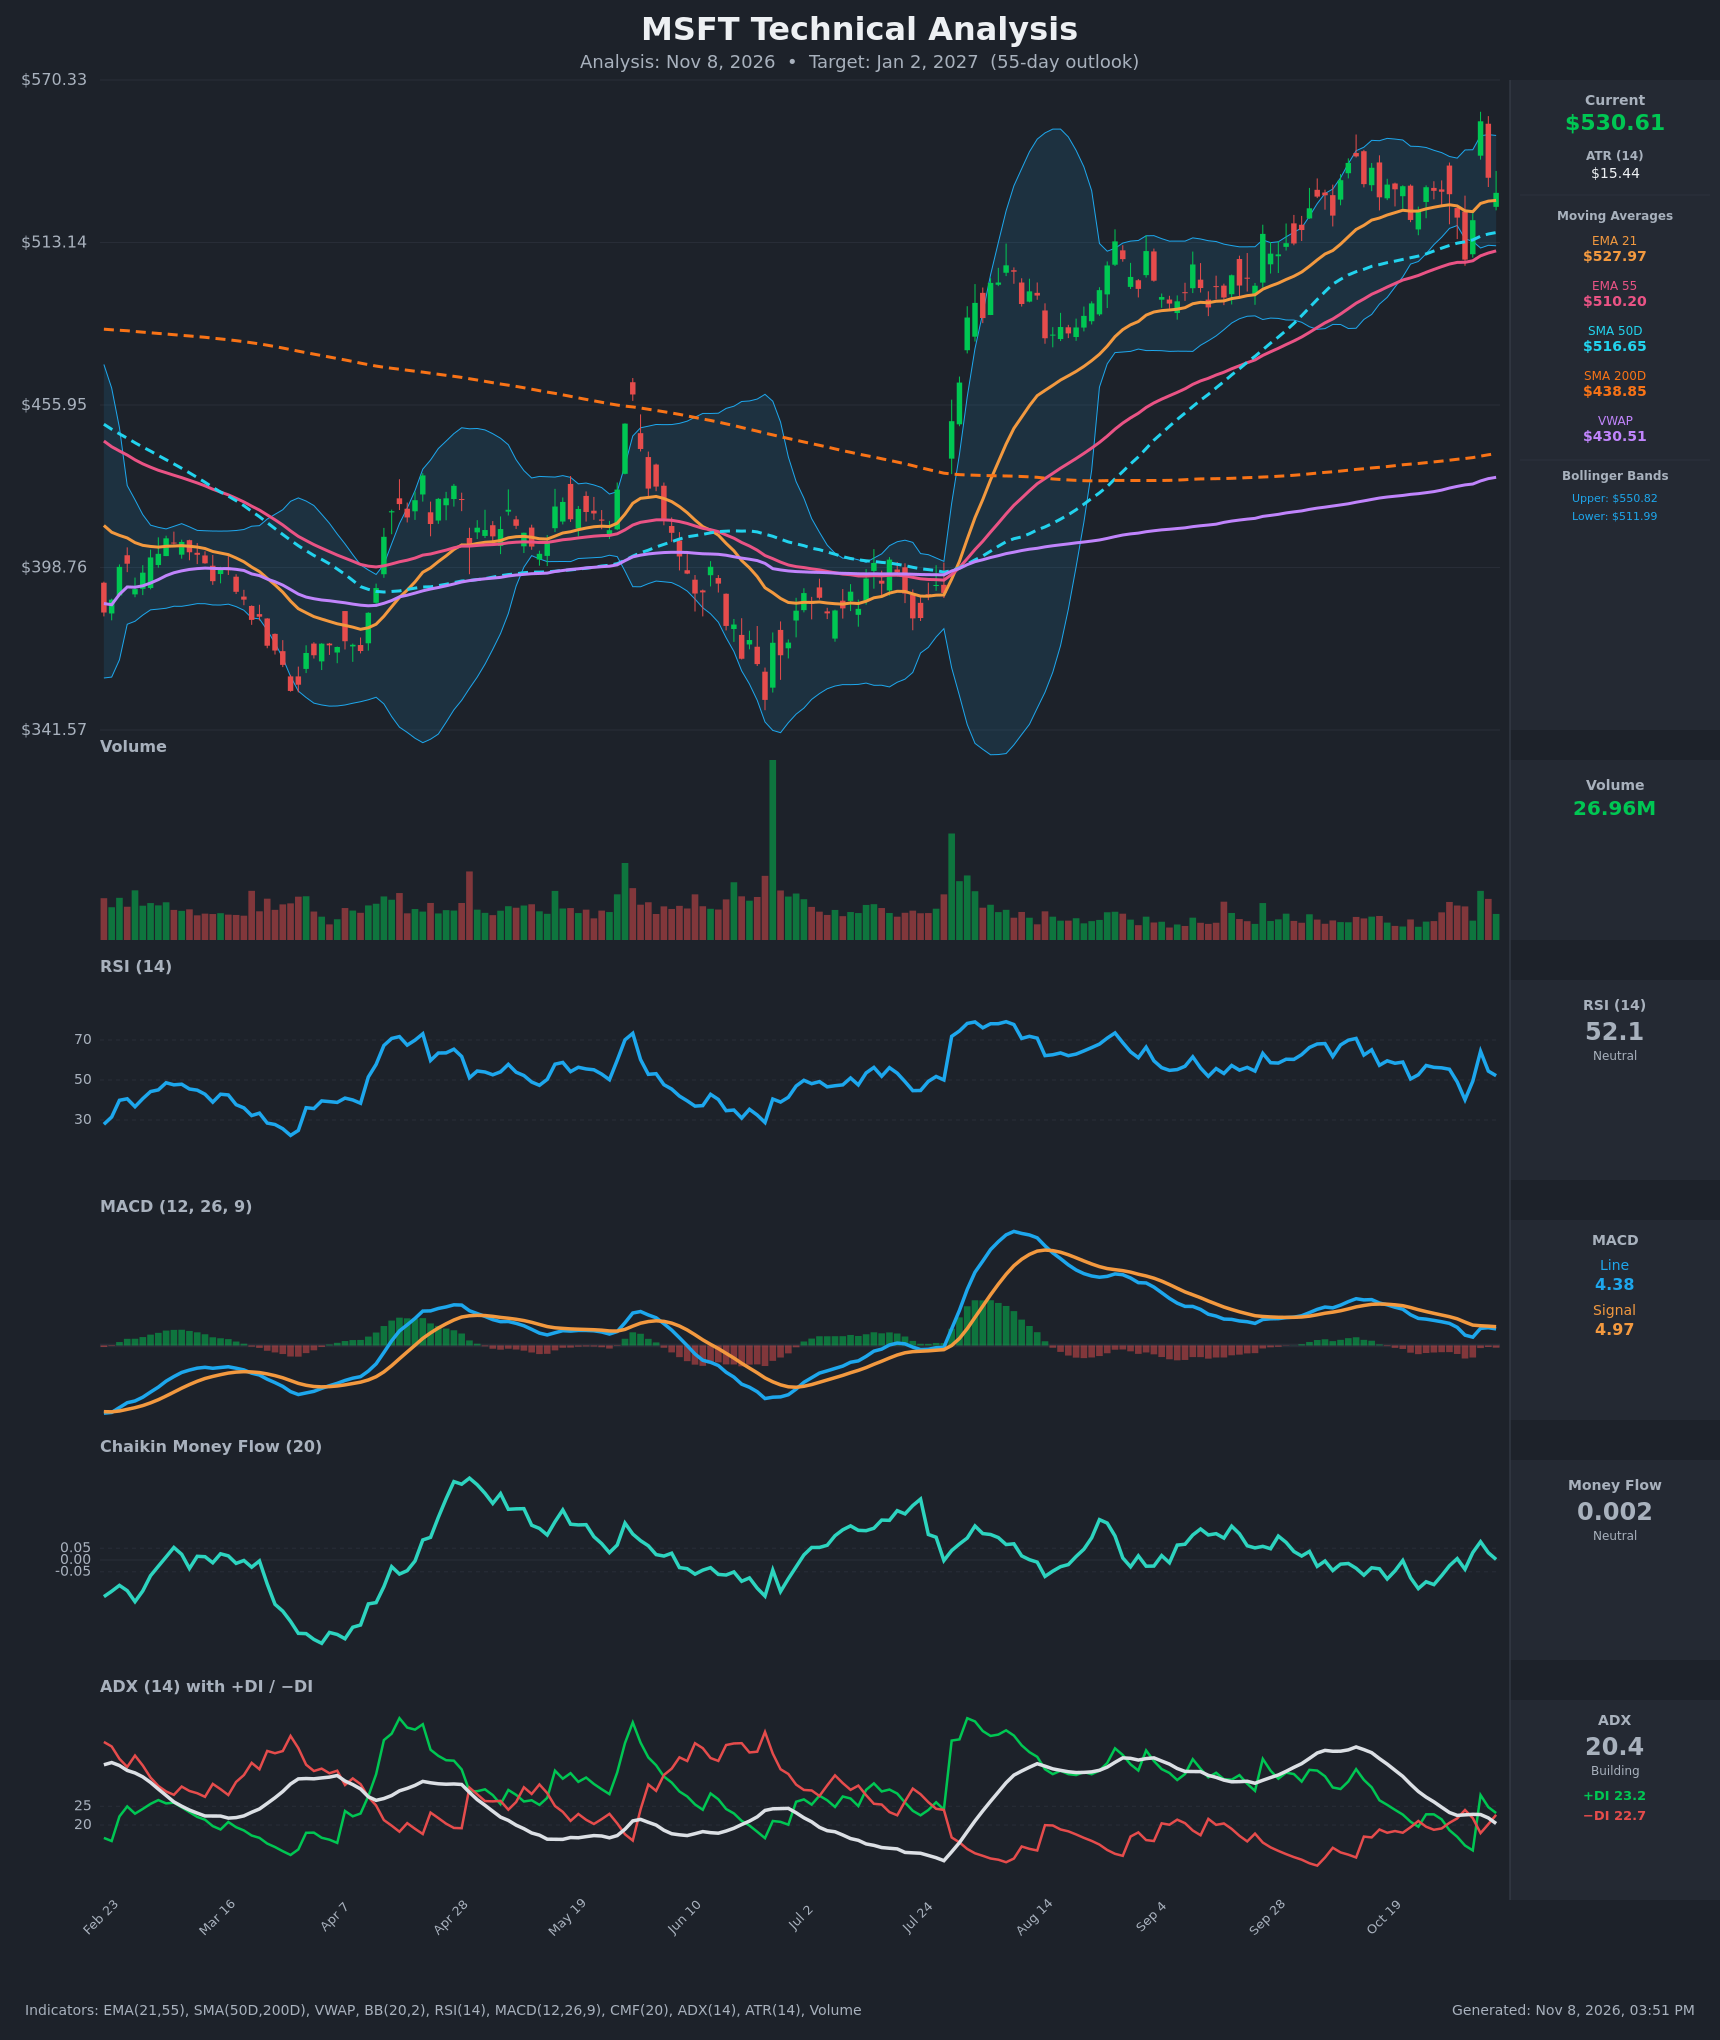
Analysis
TECHNICAL INDICATORS
- RSI (14): 52.15, near the midline. It dropped to about 40 on Nov 2, spiked to 64 on the Nov 4 surge, and has since faded back to 52. Momentum is neutral and slightly cooling, with no overbought or oversold condition. [Neutral]
- 20 EMA: The EMA 21 is $527.97, and price at $530.61 sits just above it. The EMA is rising and acting as dynamic support, and price has held it on every pullback since September. EMA21 is above EMA55 ($510.20), so the stack is bullish, but price is only barely above the EMA. [Bullish]
- MACD: The line (4.38) is below the signal (4.97), a bearish crossover that has persisted since mid-October. The histogram is slightly negative and shrinking (-0.59), so downside momentum is flattening rather than accelerating. The line is still positive, which means the larger trend remains up. [Bearish]
- Bollinger Bands (20): The upper band is $550.82 and the lower is $511.99, so price sits near the middle of the bands. The bands are moderately narrow, which implies consolidation. The Nov 4 spike to $555.80 poked through the upper band and was fully rejected. [Neutral]
- CMF (20): 0.002, well inside the ±0.05 neutral zone. It has been oscillating around zero for weeks, showing neither accumulation nor distribution. [Neutral]
- ADX (14): 20.4, down from 36 in mid-October, so the trend is fading to the weak/range-bound threshold. +DI (23.2) is only marginally above −DI (22.7), and the two lines have been crossing repeatedly. Neither side is in control. [Weak Trend, no clear direction]
- Volume: 26.96M, moderate. Volume has been subdued through most of the recent advance, with a pickup on the Nov 4 spike and the Nov 2–3 selloff and bounce. The rally has not been confirmed by strong volume. [Neutral]
DIVERGENCES & TRENDS
- Long-term trend: Strongly bullish. Price is about 21% above the SMA200D ($438.85) and above the SMA50D ($516.65), VWAP ($430.51) and EMA55. A golden cross is already in place, and the 50D, 21 EMA and 55 EMA all slope upward.
- MACD vs. price: Price is at or near its highs while MACD peaked at about 12 in August and has made lower highs since. This is a mild bearish momentum divergence, a sign of an aging, decelerating trend rather than a reversal.
- ADX: It fell from 36 to 20.4 while +DI and −DI converged, so the trend has transitioned into consolidation.
- Nov 4 candle: A large spike to $555.80 was followed by two lower closes ($535.93, then $530.61). This is a rejection at resistance, but the EMA21 cushion has held.
- Crossovers: MACD remains below its signal. EMA21 stays above EMA55 with no bearish crossover, and the gap between them is narrowing slightly, so that is worth watching. There is no death cross, and the +DI/−DI lines are tangled.
CHART PATTERNS
- Ascending Triangle / Bullish Flag-style consolidation: Price has made higher lows (about $507 → $520 → $521) against horizontal resistance in the $550–556 zone since late October. This resembles the Ascending Triangle from the reference diagram. A breakout above $556 would project roughly +$45–50, to about $600, with the measured move from the triangle height (about $50 against the rising base). I treat a full measured move over 55 days as a stretch target.
- Bearish risk: The failed spike at $555.80 resembles a mini Double Top attempt, but there is no confirmation unless the $507 low is lost. The pattern is therefore unconfirmed on both sides, and the long-term trend favors the continuation (bullish) resolution.
POTENTIAL SCENARIOS
- Scenario 1: Bullish Breakout Continuation — The uptrend resumes as price holds the EMA21/SMA50 zone, MACD re-crosses above its signal, and price retests the $556 highs. Trigger: daily close above $556 with volume above 30M, or MACD bullish crossover. Target: $545 base case, with an extension to $575–$590 on a confirmed breakout. Invalidation: daily close below $507 (the Nov 2 low). (50% probability)
- Scenario 2: Bearish Pullback to Support — Fading ADX, negative MACD and the rejected spike lead to mean reversion toward the SMA50/EMA55 area and the lower Bollinger Band. Trigger: close below $516 (SMA50) and then $507. Target: $495–$510, with a deeper test of $480. Invalidation: reclaim of $540 with MACD turning up. (30% probability)
- Scenario 3: Neutral Range Chop — Price oscillates between $507 and $556 with weak ADX and a flat CMF. Trigger: failure to break either $556 or $507. Target: $520–$540. Invalidation: close outside the $505–$558 range. (20% probability)
PRICE TARGETS
For the 55-day horizon (to about Jan 2, 2027):
- Target Price: $545.00
- Expected Range: $495.00 to $575.00 (width $80, about 15% of current price, in line with the 12–18% guidance for 30–60 days)
- Key Levels: Support at $516.65 (SMA50D, with EMA55 at $510 and the $507 swing low beneath it), Resistance at $555.80 (Nov 4 spike high)
OVERALL BIAS
OVERALL BIAS: BULLISH - The long-term trend structure is firmly bullish, with price well above rising 21/55/50/200 averages and a golden cross in place, plus higher lows into an ascending-triangle-style consolidation. Conviction is modest because MACD is below its signal, ADX is only 20, and the $555.80 spike was rejected, so a pullback toward $510–516 is possible before the next leg higher.
This is educational analysis and not financial advice.