NOK 55-day bearish forecast — Nov 8, 2026
- Bias: Bearish
- Timeframe: 55 days (made Nov 8, 2026, target date Jan 1, 2027)
- Price at analysis: $7.66
- Price target: $7.10
- Expected range: $6.20 – $8.30
- Result: Pending — graded after the close on Jan 1, 2027
Get a free AI analysis of NOK today
Analysis
TECHNICAL INDICATORS
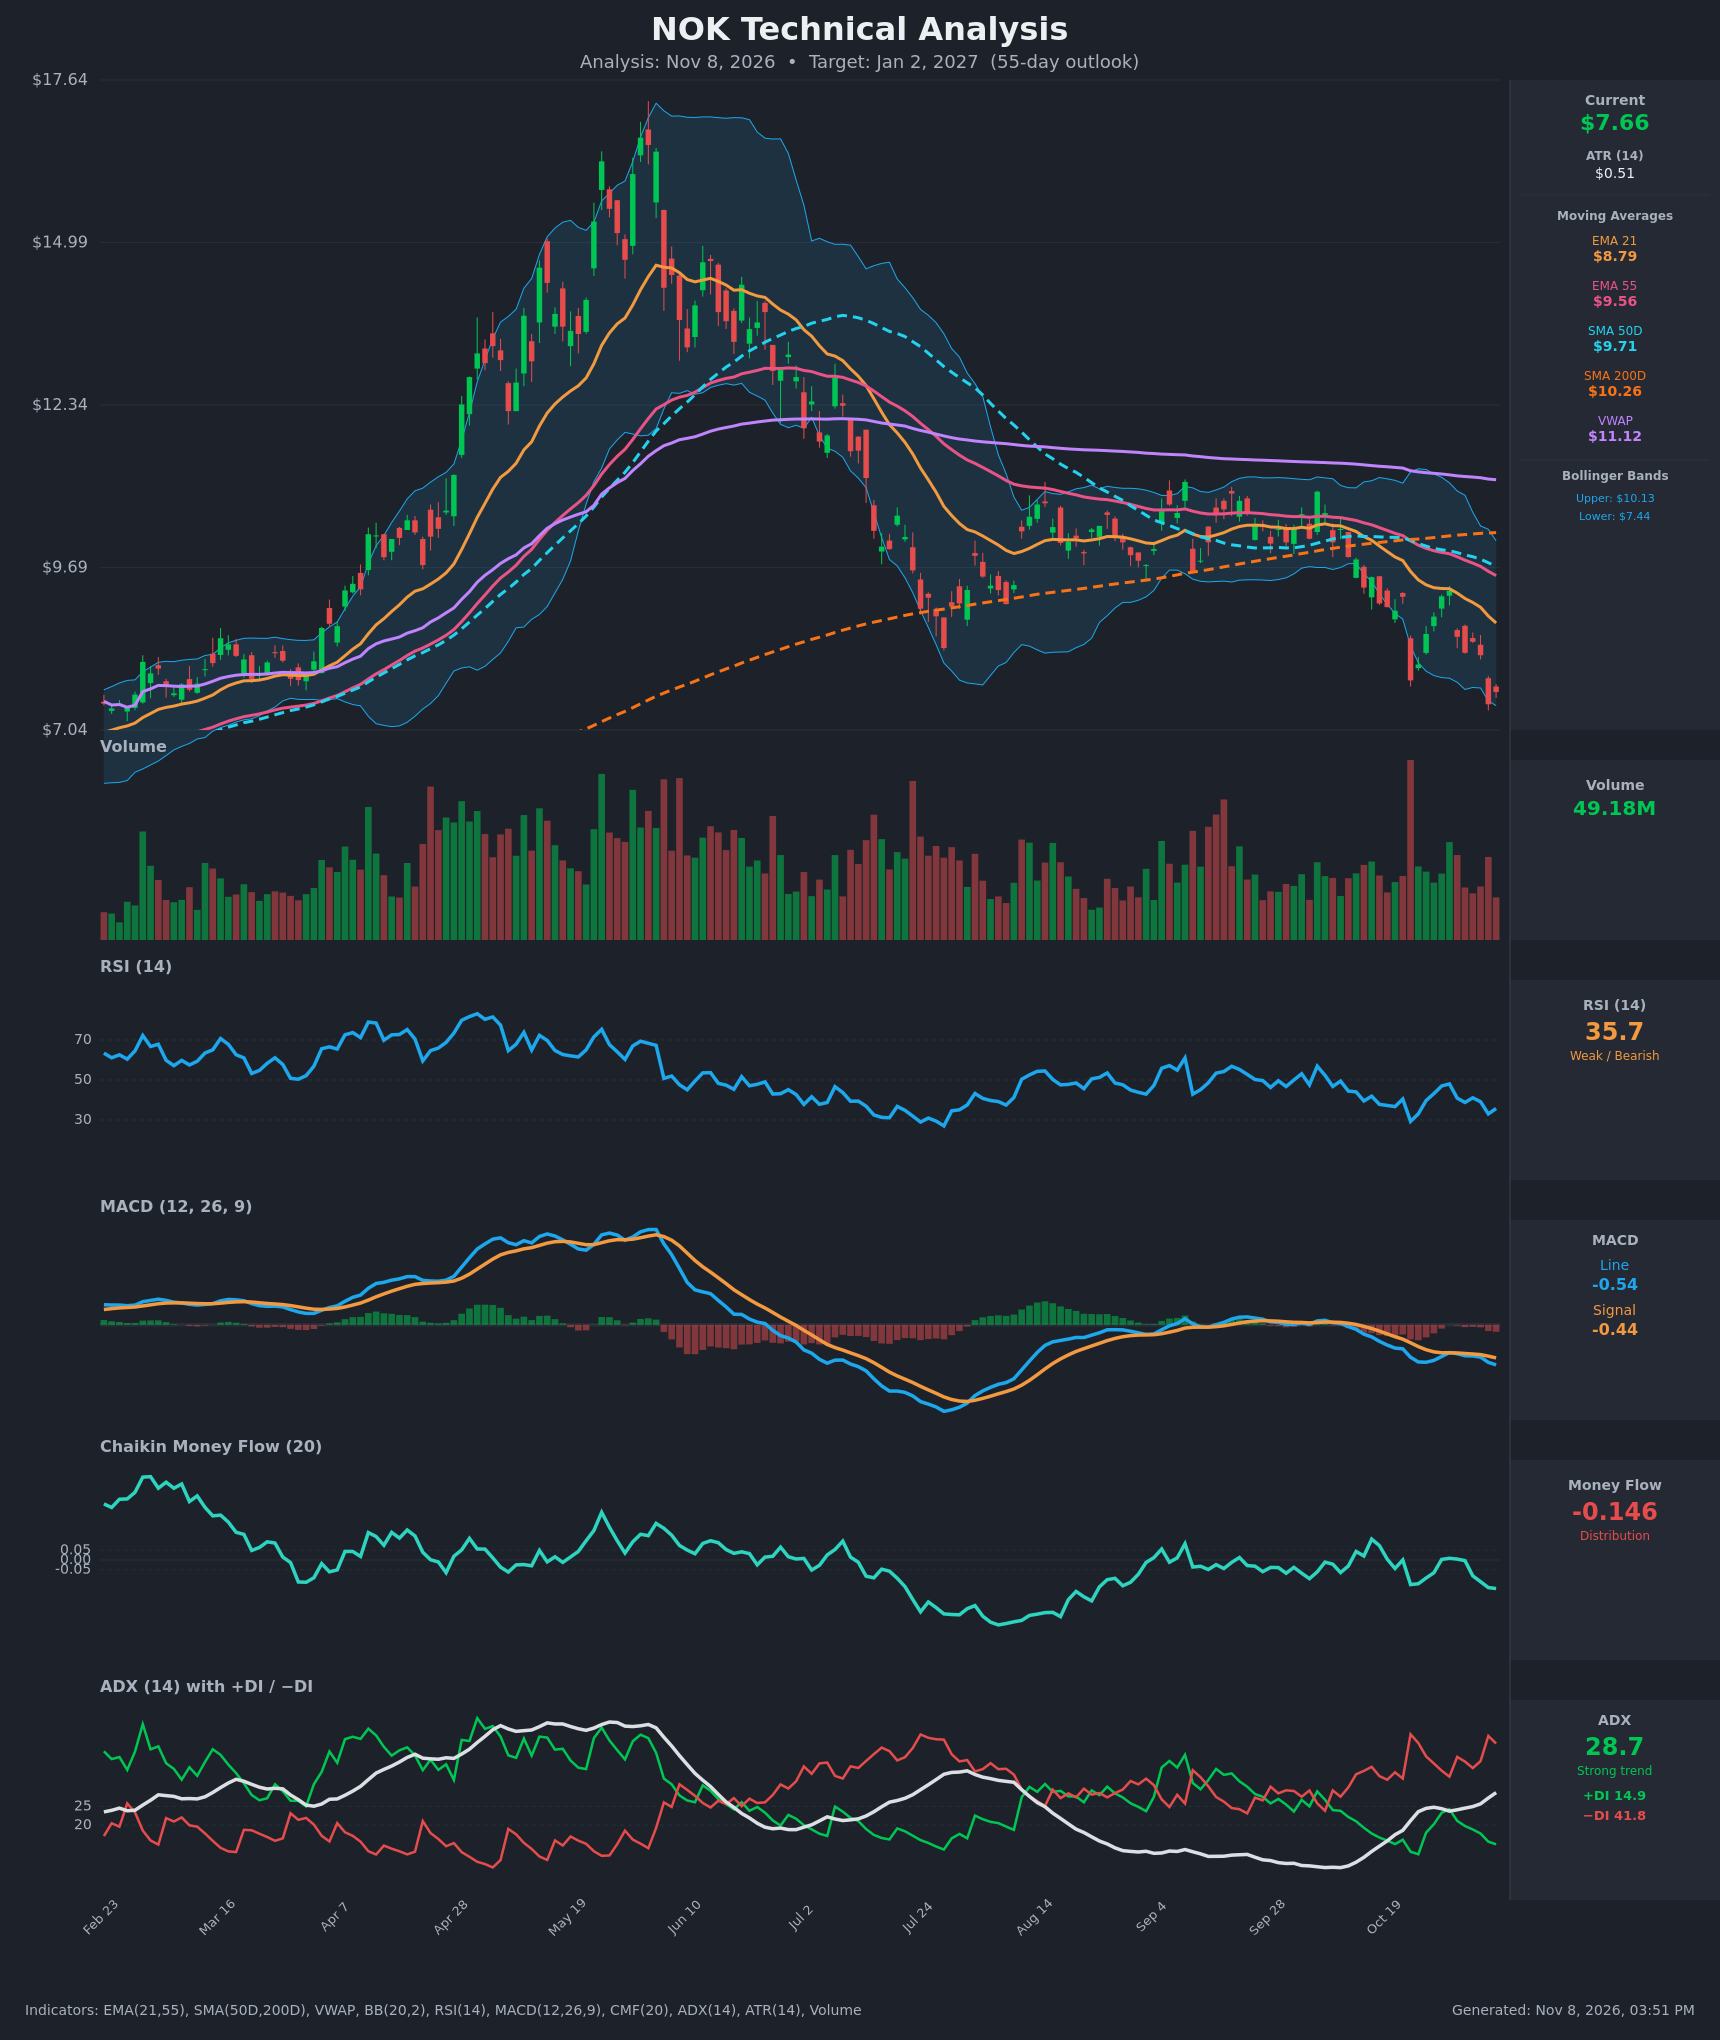
- RSI (14): 35.75, below the 50 midline and approaching the 30 oversold line. It was 48 on Oct 29 and has made lower highs since, so momentum is still falling. It has not reached an oversold extreme or shown a bullish divergence. [Bearish]
- 20 EMA (EMA 21): $8.79, with price at $7.66 about 13% below it. The EMA 21 is sloping down and sits below the EMA 55 ($9.56), so it acts as overhead resistance. [Bearish]
- MACD: Line -0.535 is below signal -0.442, and the gap widened from the Oct 29 crossover. The histogram is negative and expanding, and both lines are below zero. [Bearish]
- Bollinger Bands (20): Upper $10.13, lower $7.44. Price at $7.66 sits just above the lower band after riding it, which shows a downside walk. The bands are widening and the lower band is declining. A short-term bounce is possible, but this is not a reversal signal. [Bearish]
- CMF (20): -0.146, well below -0.05 and making new lows in the recent run. Distribution is persistent. [Distribution]
- ADX (14): 28.7 and rising from 15.8 on Oct 19, which is a strong and strengthening trend. −DI at 41.8 is far above +DI at 14.9, so sellers control the trend. [Strong Trend – Bearish]
- Volume: 49.18M, around average. Selling days such as Oct 22 and Nov 5 carry the heaviest volume, and rebounds come on lighter volume. There is no capitulation spike yet. [Bearish – selling pressure on down days]
DIVERGENCES & TRENDS
- No bullish divergence. RSI (35.75) and MACD both made lower lows alongside price (Nov 5 low $7.46), so momentum confirms the decline.
- Moving average structure: Price ($7.66) is below EMA21 ($8.79), EMA55 ($9.56), SMA50D ($9.71), SMA200D ($10.26) and VWAP ($11.12). That is a full bearish stack.
- Crossovers: EMA21 is already below EMA55. SMA50D ($9.71) is approaching a death cross with SMA200D ($10.26), and the gap has narrowed from about $0.07 to about $0.55. The SMA200D itself is flat to rising.
- Trend reversal in the DI lines: On Oct 29 +DI (24.3) was briefly above −DI (33.0 → still below), and the DI gap has since widened to −DI 41.8 vs +DI 14.9.
- MACD: The bearish crossover happened around Oct 29–30 and has since extended.
- Trend context: The Jun peak near $17 was followed by a collapse, a range of about $8–$10.5 through the summer and early fall, and now a breakdown below that range's lower boundary.
CHART PATTERNS
- Range breakdown, with a Bearish Rising Wedge / Descending Triangle flavor: Price built lower highs under the falling EMAs and broke below the roughly $8.0–$8.3 support zone. This is closest to the diagram's Descending Triangle / continuation-down structure.
- Measured move: The summer range was roughly $8.2 to $10.5, about $2.3 deep. Projecting that below the $8.0 breakdown gives about $5.7–$6.0, which is an extreme target. A more reasonable 55-day objective is $6.60–$7.00.
- The $7.46 low was only marginally breached, and the stock is near the lower Bollinger Band, so a relief bounce toward the $8.20–$8.50 gap/EMA zone is likely at some point before the downtrend resumes.
POTENTIAL SCENARIOS
- Scenario 1: Bearish Trend Continuation — Price stays under the declining EMAs and resumes the downtrend after minor bounces, with distribution and a strong −DI. Trigger: close below $7.40 (the recent low and lower band). Target: $6.70, with an extension to $6.20. Invalidation: daily close above $8.80 (EMA21). (55% probability)
- Scenario 2: Neutral Base and Chop — Oversold conditions and the lower band attract buyers, and price oscillates in a $6.90–$8.40 range as ADX fades. Trigger: RSI holds above 30 with stabilizing CMF. Target: $7.50–$8.00. Invalidation: break below $6.90 or above $8.80. (25% probability)
- Scenario 3: Bullish Oversold Reversal — A sharp mean-reversion rally takes price back toward the moving average cluster. Trigger: MACD bullish crossover and a close above $8.80. Target: $9.50–$9.70 (EMA55/SMA50D). Invalidation: close back below $7.40. (20% probability)
PRICE TARGETS
- Target Price: $7.10 (55-day, Jan 2, 2027)
- Expected Range: $6.20 to $8.30 (width $2.10, about 27% of the current price, in line with the 18–30% guidance for 61–180 days and slightly wider than the 12–18% guide for 30–60 days to account for ATR of $0.51 and high trend strength)
- Key Levels: Support at $7.40 (Bollinger lower band and recent low), Resistance at $8.79 (EMA 21)
OVERALL BIAS
OVERALL BIAS: BEARISH - Price is below every moving average and VWAP, MACD is negative and widening, CMF shows persistent distribution, and ADX at 28.7 with −DI (41.8) far above +DI (14.9) confirms a strong downtrend. RSI is near oversold, so expect a possible relief bounce, but the path of least resistance is lower.
This is educational analysis and not financial advice.