NFLX 55-day bearish forecast — Nov 8, 2026
- Bias: Bearish
- Timeframe: 55 days (made Nov 8, 2026, target date Jan 1, 2027)
- Price at analysis: $63.41
- Price target: $58.50
- Expected range: $54.00 – $67.00
- Result: Pending — graded after the close on Jan 1, 2027
Get a free AI analysis of NFLX today
Analysis
TECHNICAL INDICATORS
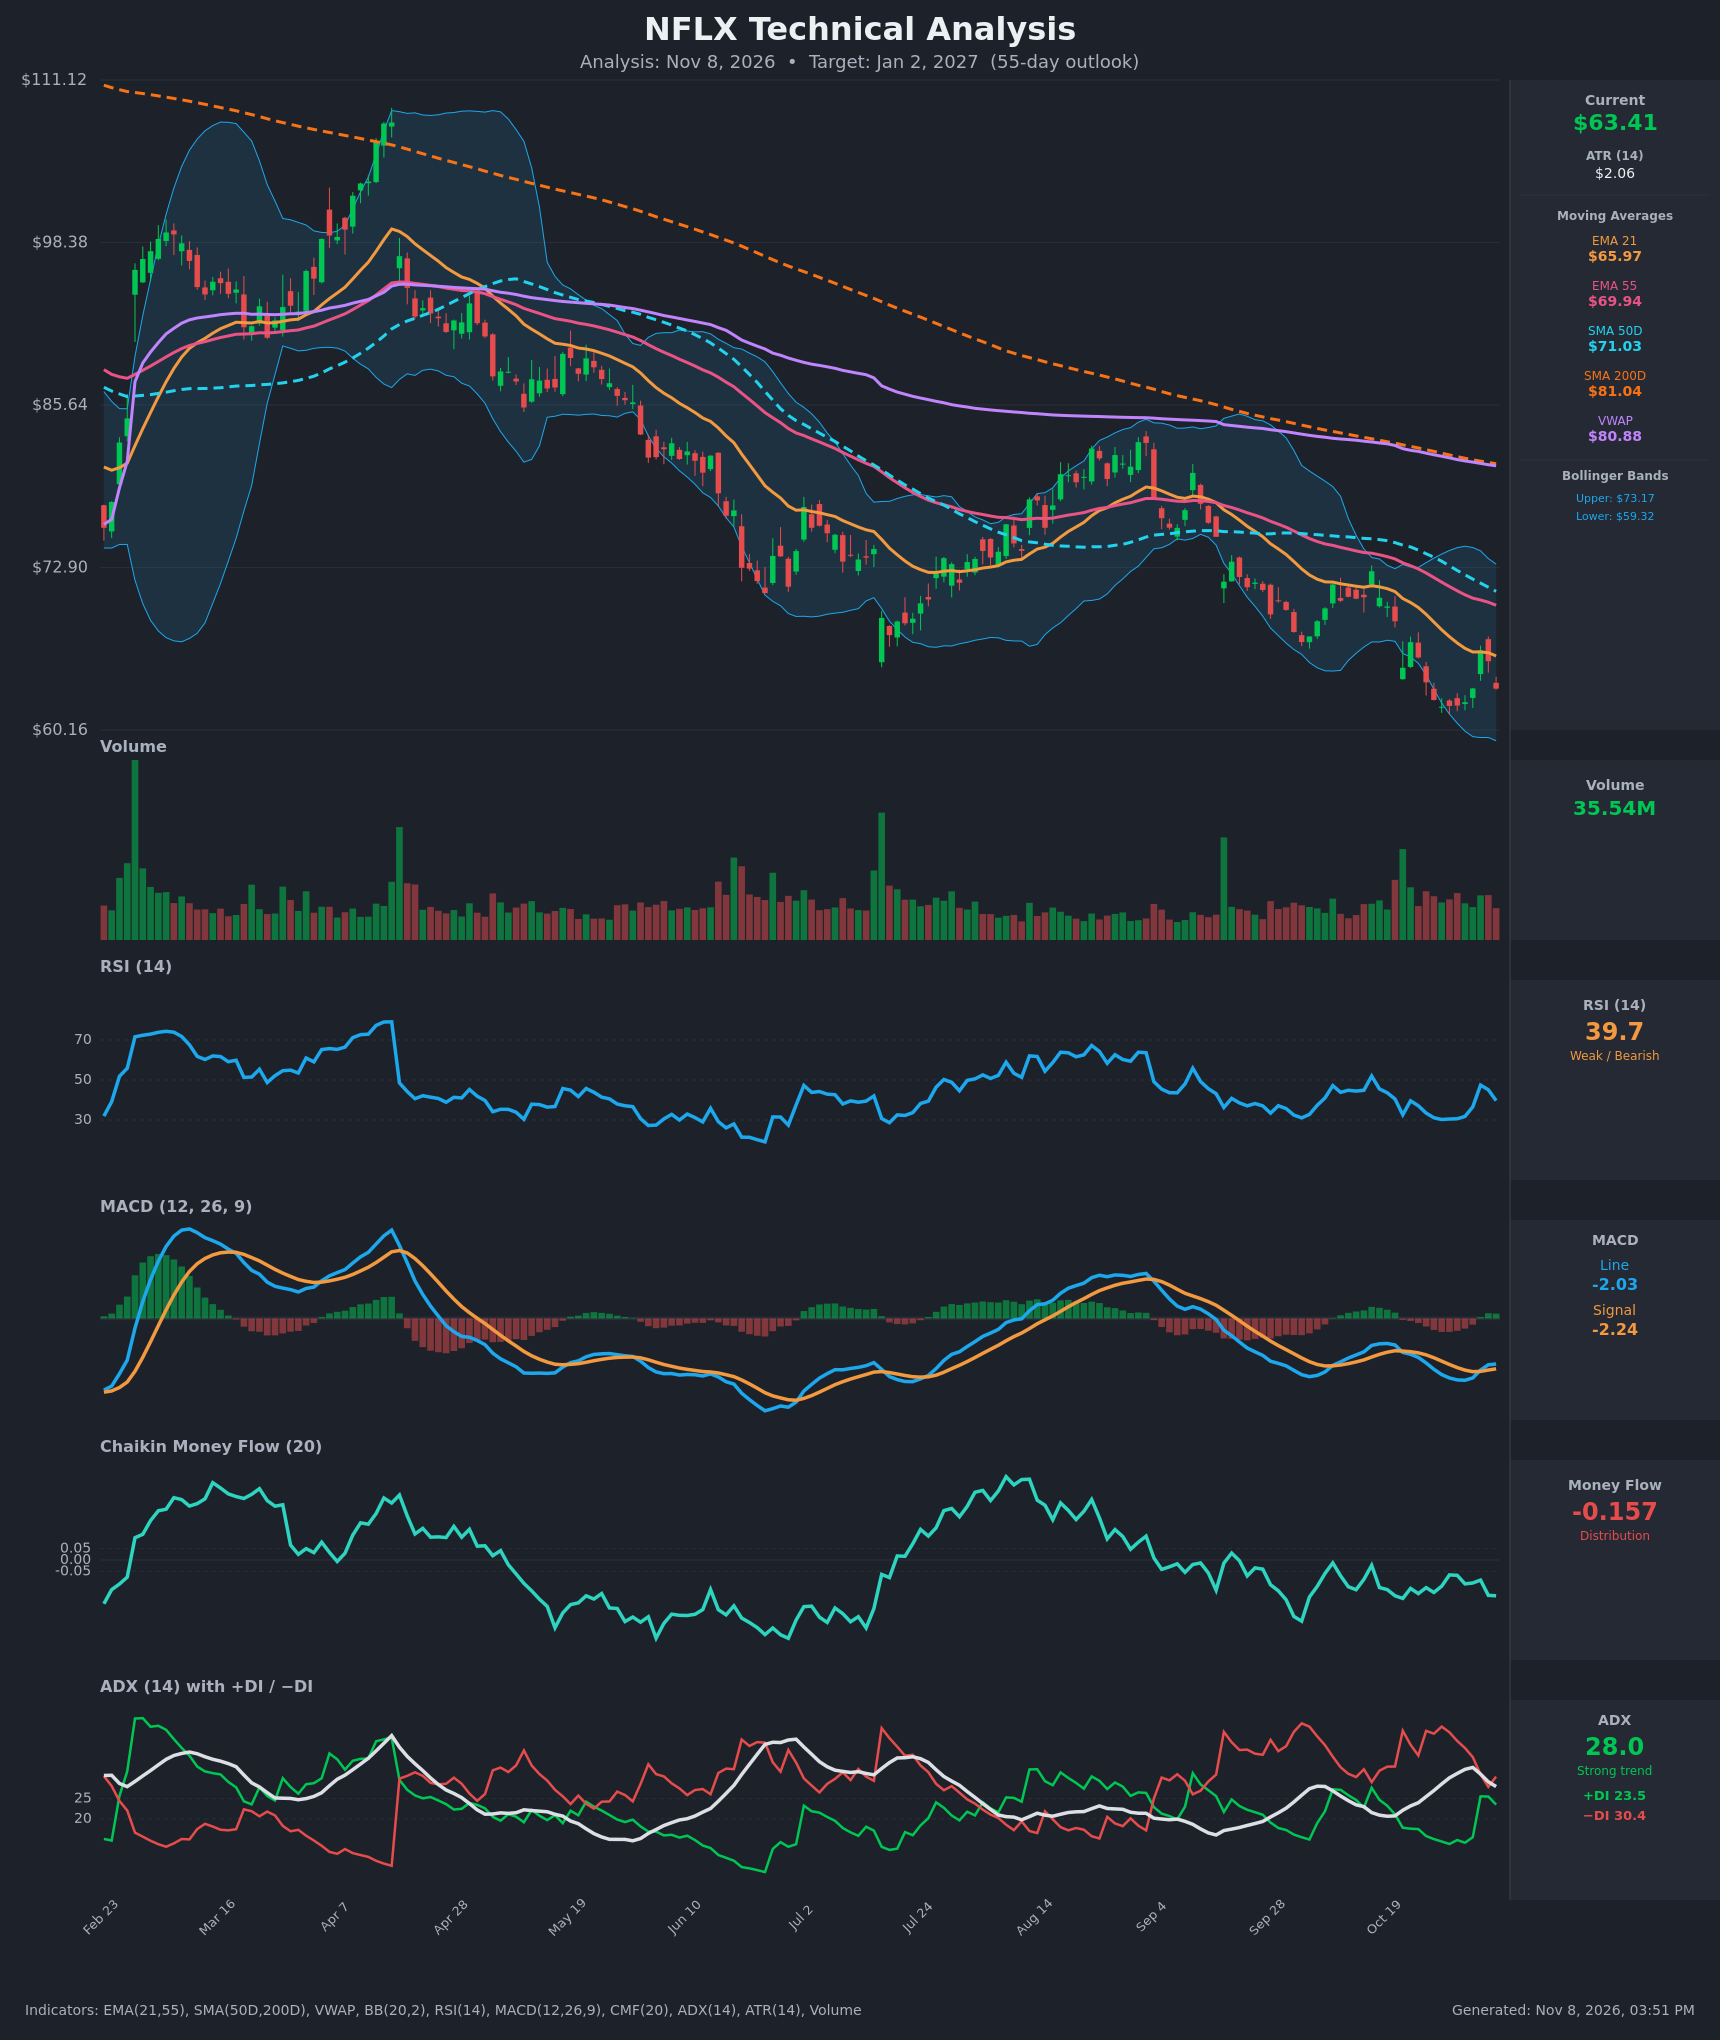
- RSI (14): 39.68, below 50 and in bearish territory but not oversold. It bounced from about 30 to 47.5 on Nov 4 and has rolled over to 39.7. It has not made it back above 50 in months, which shows weak momentum. [Bearish]
- 20 EMA: The 21 EMA is $65.97 and price at $63.41 is below it, so it acts as resistance. The stack is bearish, with EMA21 below EMA55 ($69.94), below SMA50D ($71.03), below SMA200D ($81.04). Price also sits well below VWAP ($80.88). [Bearish]
- MACD: The line is -2.03 and the signal is -2.24, so the line is marginally above the signal, a weak bullish crossover that happened around Nov 4. Both are deeply negative and the histogram is only slightly positive. The line has been rising for three bars but is flattening as price pulls back. This is a minor relief signal inside a downtrend. [Neutral]
- Bollinger Bands (20): The upper band is $73.17 and the lower is $59.32, so the midline is about $66.25. Price at $63.41 is in the lower half, below the midline, and rejected near the midline ($66.39 close on Nov 4). The lows near $62 hold above the lower band. Price has been riding the lower half since October. [Bearish]
- CMF (20): -0.157, well below -0.05, and negative for most of the past few months. That shows persistent distribution, with no sign of accumulation yet. [Distribution]
- ADX (14): 28.0, a strong trend but off its peak of 32.7. −DI (30.4) is above +DI (23.5), so bears are in control. The Nov 4 bounce narrowed the gap, but the spread is widening again. [Strong Trend – Bearish]
- Volume: 35.54M on the latest bar, in line with or slightly above recent averages. The Nov 4 bounce came on modest volume, with no major capitulation spike at the lows. Without a capitulation spike, the selling looks orderly rather than exhausted. [Neutral to mildly Bearish]
DIVERGENCES & TRENDS
- No bullish price/RSI divergence: Price made lower lows on Oct 28 ($61.99) and again near $62.0 on Oct 29–Nov 2. RSI held flat at about 30–31, which shows selling pressure stabilizing but not a true higher-low divergence.
- MACD: The line made a weaker low (-2.75) relative to the recent trough, and the recent line-over-signal crossover is a mild improvement. It is occurring far below zero, so it is a low-quality signal.
- Moving averages: The death cross is long established, with SMA50D far below SMA200D. EMA21 is below EMA55 and the gap is widening (about $4 now). SMA200D is declining steadily, from about $111 at the start of the chart to $81 now, which confirms a persistent long-term downtrend.
- Lower highs: The chart shows a series of lower highs (about $105, $93, $82, $73) and now lower lows, a classic downtrend sequence.
- CMF and DI: CMF has been negative since the late-September peak and −DI has dominated. Both are consistent with the price decline.
CHART PATTERNS
- Bearish continuation structure: The longer-term sequence of lower highs and lower lows resembles a stair-step descending channel. Each rally has failed at a falling EMA21 or EMA55.
- Possible Bullish Double Bottom (tentative): Price tested about $62 on Oct 28–Nov 2 and bounced to $66.39. If $62 holds and price clears $66.4–$67, a double-bottom measured move would reach roughly $70–71, near the SMA50D. That is not confirmed, and the latest close at $63.41 is fading back toward the lows.
- Bearish Flag (small): The Nov 3–6 bounce and fade is a small corrective structure under the EMA21. A break below $62 would point to a measured move toward the mid-$50s.
- Significance: The downtrend dominates. A close below $62 would be a breakdown to new lows with no chart support below it in this window, and the measured target is roughly $56–58.
POTENTIAL SCENARIOS
- Scenario 1: Bearish Downtrend Continuation — The strong downtrend (ADX 28, −DI > +DI), the stacked bearish MAs, and persistent distribution (CMF -0.157) favor another leg lower after the weak relief bounce failed at the EMA21. Trigger: close below $62.00 (the Oct 28–Nov 2 lows). Target: $56–$58, with extension to $54. Invalidation: daily close above $68 (above EMA21 and the bounce high). (55% probability)
- Scenario 2: Neutral Base and Range — Price stabilizes between $59 and $68 as RSI holds around 30–45 and sellers tire, forming a double-bottom-style base. Trigger: repeated holds above $61–62 with declining volume on down days. Target: $62–$67. Invalidation: close below $60 or above $69. (25% probability)
- Scenario 3: Bullish Relief Rally — The MACD bullish crossover and the double bottom at $62 produce a rebound toward the declining SMA50D. Trigger: close above $66.40 and then above EMA21/EMA55. Target: $70–$72. Invalidation: close back below $62. (20% probability)
PRICE TARGETS
Timeframe: 55 days (target date Jan 2, 2027). Range width check: $73.00 − $52.50 = $20.50 on a $63.41 price, which is about 32%. That is above the 12–18% guidance for 30–60 days, so I tightened the range to $54.00 – $67.00. The $13.00 width is about 20.5% of price, which is slightly above the guidance to reflect elevated volatility (ATR of $2.06 is about 3.2% of price, and a 55-day move is wide at this volatility).
- Target Price: $58.50 (about 7.7% below current, in line with the bearish measured move and trend persistence)
- Expected Range: $54.00 to $67.00
- Key Levels: Support at $59.32 (lower Bollinger Band, with $62.00 as the nearer swing-low support); Resistance at $65.97 (EMA21, with $69.94 EMA55 as the next level above)
OVERALL BIAS
OVERALL BIAS: BEARISH - Price is below every moving average in a stacked bearish alignment, −DI leads +DI with ADX at 28, CMF shows persistent distribution at -0.157, and RSI is stuck below 50. The weak MACD crossover is not enough to offset these, and a close below $62 opens the way toward the high-$50s.
This is educational analysis and not financial advice.