NBIS 55-day bearish forecast — Nov 8, 2026
- Bias: Bearish
- Timeframe: 55 days (made Nov 8, 2026, target date Jan 1, 2027)
- Price at analysis: $129.49
- Price target: $118.00
- Expected range: $108.00 – $131.00
- Result: Pending — graded after the close on Jan 1, 2027
Get a free AI analysis of NBIS today
Analysis
TECHNICAL INDICATORS
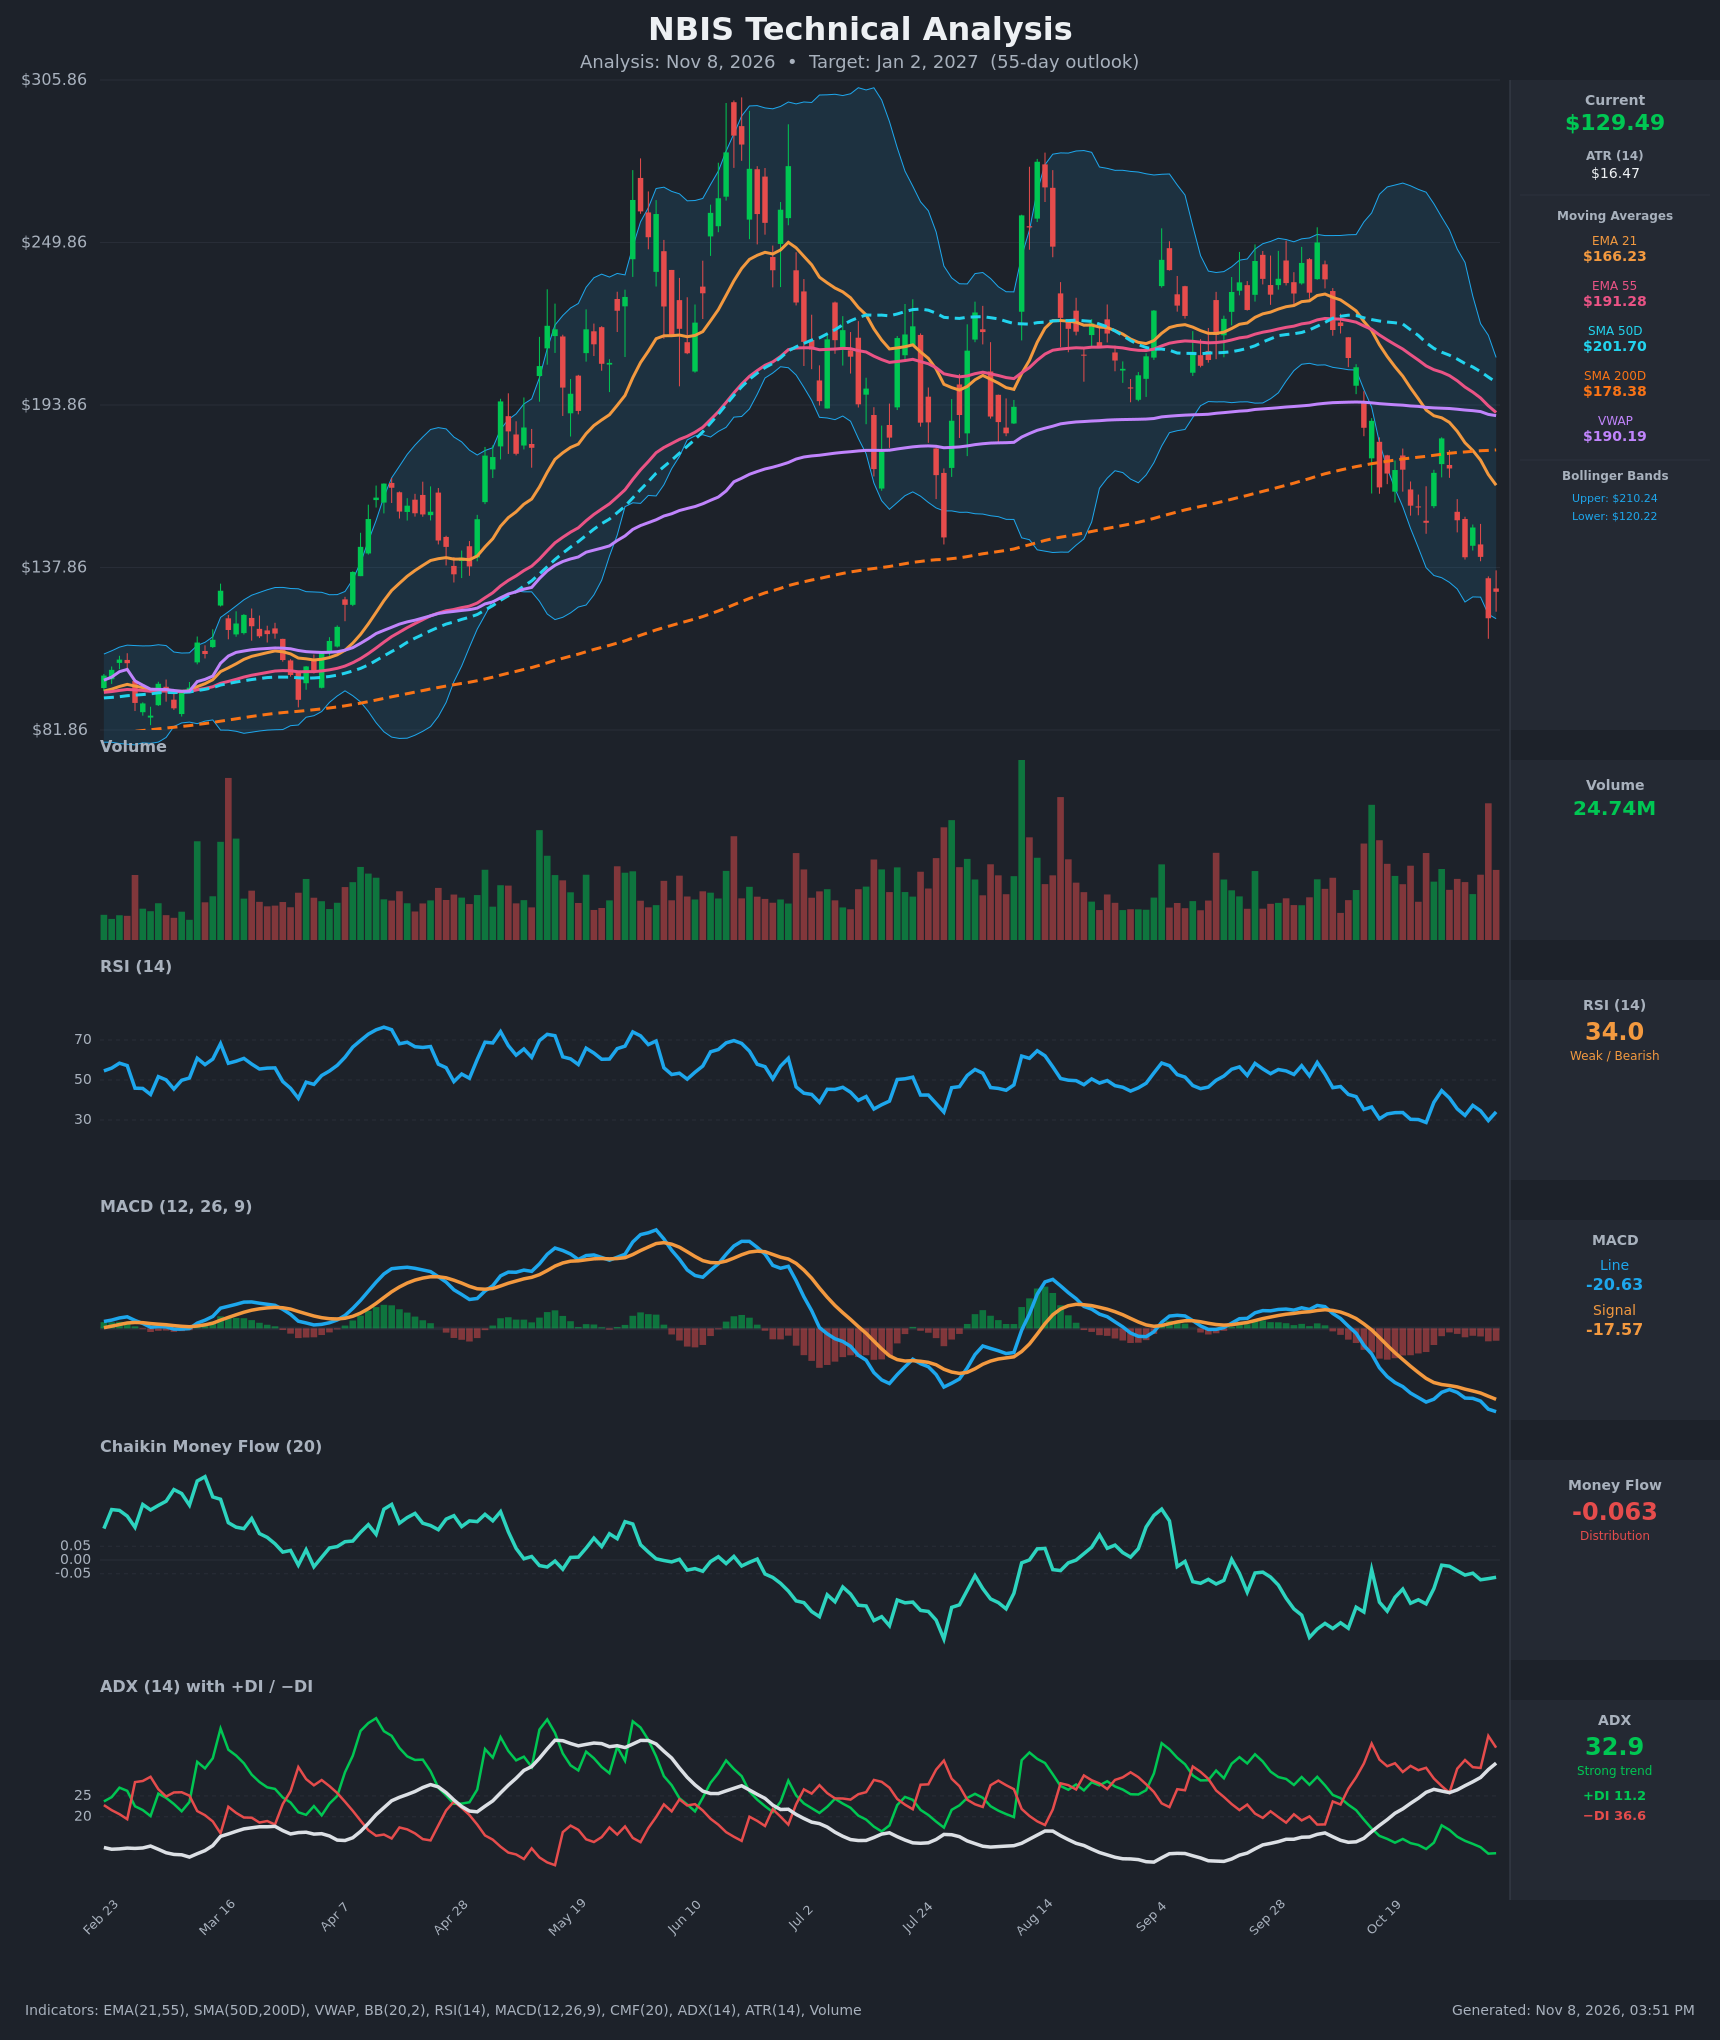
- RSI (14): 34.03, bouncing off 29.7 on Nov 5 but still below 40 and under the 50 midline. RSI has stayed in the 29–45 band for weeks, which is typical of a downtrend. It is near oversold but not yet at an extreme, so a relief bounce is possible without a trend change. [Bearish]
- 20 EMA (EMA 21): $166.23, about 28% above price and falling steeply (from $210.58 on Oct 19). Price is far below it, so it acts as overhead resistance. EMA21 is also below EMA55 ($191.28), a bearish crossover already in place. [Bearish]
- MACD: Line -20.63 is below signal -17.57. The gap widened from the Oct 28 low, and the histogram is negative and expanding. There is no bullish crossover yet, so momentum is still deteriorating. [Bearish]
- Bollinger Bands (20): Upper $210.24, lower $120.22. Price is at $129.49, in the lower 10% of the band after tagging the lower band at $120.37. The bands are wide and trending lower, so this looks like a downtrend "band walk" rather than a mean-reversion setup. A bounce toward the midline (~$165) is possible, but the evidence favors trend continuation. [Bearish]
- CMF (20): -0.063, below the -0.05 threshold, so mild distribution. The reading is not extreme, and it has recovered from -0.186 on Oct 19. Selling pressure is easing but has not turned into accumulation. [Distribution]
- ADX (14): 32.9 and rising (from 19.3). −DI at 36.6 is far above +DI at 11.2, with +DI at its lowest in months. This is a strong, one-sided downtrend with the bears in full control. [Strong Trend – Bearish]
- Volume: 24.74M, elevated. The Nov 5 capitulation drop to $120.37 came on one of the largest volume bars of the recent period, and heavy red volume has marked the whole decline. The Nov 6 bounce (+7.6%) shows buyers stepping in, but it is a single session without follow-through. [Selling climax / bounce unconfirmed – Bearish-leaning]
DIVERGENCES & TRENDS
- Divergences: There is no confirmed bullish divergence. RSI's Nov 5 low (29.7) was higher than its Oct 26 low (28.8) while price made a much lower low ($120.37 vs $153.27). That is a slight, unconfirmed positive hint, and the MACD is still making new lows.
- Trend: Price is well below the EMA21, EMA55, SMA50D and VWAP ($190.19), and now also below the SMA200D ($178.38). The break below the long-term average is a major structural shift. The SMA50D ($201.70) is falling toward the SMA200D, and a death cross looks likely within the next several weeks if the decline continues.
- Crossovers: EMA21 is below EMA55 (bearish). MACD is below signal with a widening gap. −DI has been above +DI since late October, and the gap is widening.
- Trend of CMF: It has been negative since roughly July, with only brief positive spikes.
- Risk to the bearish view: Price just closed back near the lower Bollinger Band after a capitulation-style wick, so a sharp relief rally is plausible. ATR of $16.47 (~12.7% of price) means swings are large.
CHART PATTERNS
- Bearish topping structure: The chart shows a broad top, with a peak near $295 in June followed by lower highs near $270 (Aug) and $245–250 (Sep–Oct). This resembles a loose Bearish Head and Shoulders / rounded top from the reference diagram. The price has now broken below the ~$140–150 neckline zone (the July trough was ~$150), which supports further downside. The measured move points toward the ~$100 area and below.
- Falling channel / continuation: The recent decline from ~$245 is a steep descending sequence of lower highs and lower lows, consistent with bearish continuation. There is no clean flag or pennant yet.
- Possible relief pattern: If price stabilizes between ~$120 and ~$150, a Bullish Falling Wedge or Double Bottom at the $120 level could develop. Neither is confirmed.
- Targets: The pattern points to $100–$105 on a break of $120. A recovery would first meet resistance at $141–$153 and then the EMA21 at ~$166.
POTENTIAL SCENARIOS
- Scenario 1: Bearish Trend Continuation — Strong ADX with −DI dominance, a widening MACD gap and a break below the SMA200D point to a retest of the $120 low and a break lower. Rallies fade at $141–$150 and the SMA50D/SMA200D death cross follows. Trigger: daily close below $120.37 on rising volume. Target: $105 (with an extension toward $95–$100). Invalidation: daily close above $153 (the Oct 26 level) with MACD turning up. (50% probability)
- Scenario 2: Bullish Relief Rally / Mean Reversion — After the capitulation low and a tag of the lower Bollinger Band, RSI recovers above 45 and price squeezes toward the EMA21. Trigger: close above $141.50 and then $153 with improving CMF. Target: $155–$166. Invalidation: close back below $120. (30% probability)
- Scenario 3: Neutral Base-Building — Price consolidates after the sell-off, oscillating between $115 and $142 as ADX peaks and rolls over. Trigger: failure to break either $120 or $142 for several weeks. Target: $125–$135. Invalidation: a decisive close outside $115–$145. (20% probability)
PRICE TARGETS
- Target Price: $118.00 (55-day horizon, approx. Jan 2, 2027)
- Expected Range: $108.00 to $131.00. Width is $23, about 17.8% of the current price, in line with the 55-day guidance of ~12–18%.
- Key Levels: Support at $120.37 (Nov 5 low; below that, $105), Resistance at $141.50 (early-November closes; next at $153)
OVERALL BIAS
OVERALL BIAS: BEARISH - Price is below every major moving average, including the SMA200D. MACD is below signal with an expanding negative histogram, and ADX of 32.9 with −DI (36.6) far above +DI (11.2) confirms a strong downtrend, with CMF still in distribution. The near-oversold bounce is the main risk, but it lacks confirmation and the topping structure points lower.
This is educational analysis and not financial advice.