CRWV 83-day bearish forecast — Nov 8, 2026
- Bias: Bearish
- Timeframe: 83 days (made Nov 8, 2026, target date Jan 29, 2027)
- Price at analysis: $46.40
- Price target: $41.00
- Expected range: $35.00 – $48.00
- Result: Pending — graded after the close on Jan 29, 2027
Get a free AI analysis of CRWV today
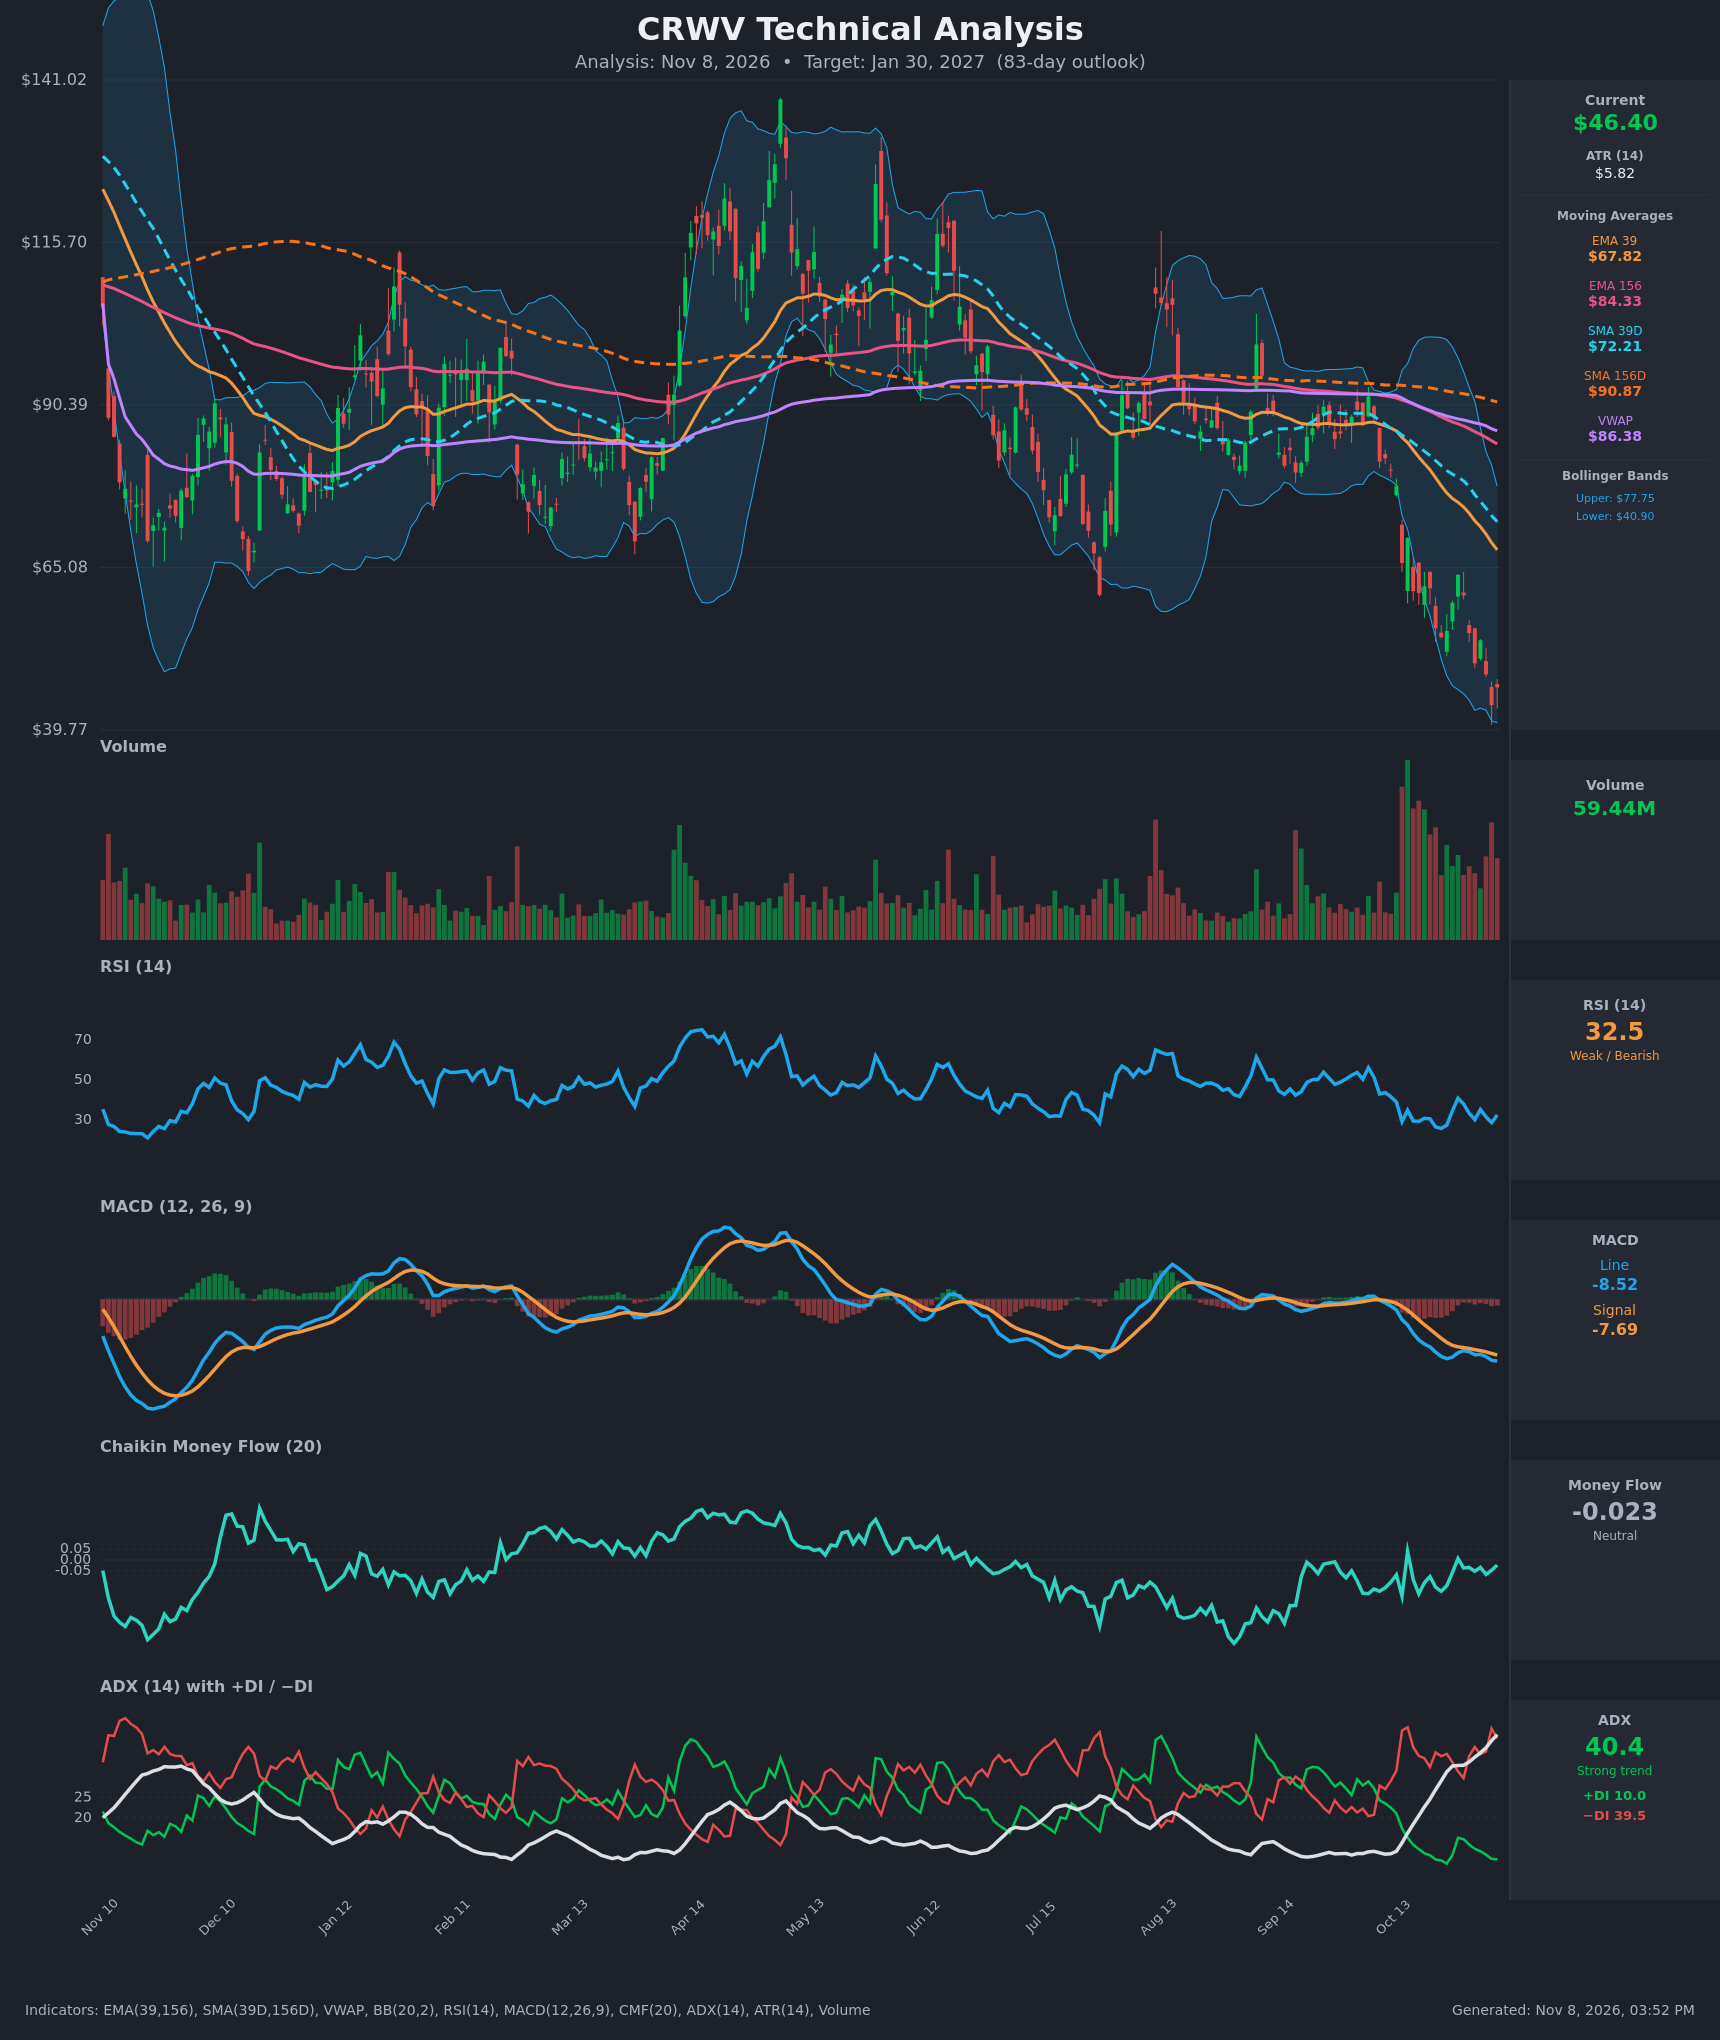
Analysis
TECHNICAL INDICATORS
- RSI (14): 32.51, just above the oversold line. It has been stuck between 25 and 41 for about three weeks, and every bounce (40.9 on Oct 28, 35.2 on Nov 3) failed at lower highs. Momentum is weak but not yet showing a bullish reversal. [Bearish]
- 20 EMA (EMA 39/156 used): The EMA 39 is $67.82 and the EMA 156 is $84.33. Price at $46.40 is about 32% below the EMA 39. The EMA 39 is below the EMA 156 and falling about $1.1 per day, so both act as heavy overhead resistance. [Bearish]
- MACD: The line (-8.52) is below the signal (-7.69), and the gap has widened over the last several sessions. Both are deeply negative and making new lows, so the histogram is negative and expanding. There is no bullish crossover. [Bearish]
- Bollinger Bands (20): The upper band is $77.75 and the lower band is $40.90. Price is in the lower third of the bands, about 13% above the lower band, after riding it for two weeks. The bands are wide, which means high volatility, and a downside expansion is underway. Walking the lower band signals a strong downtrend, but it also leaves room for a mean-reversion bounce. [Bearish]
- CMF (20): -0.023 is inside the neutral band. It has improved from -0.155 on Oct 19, so selling pressure is easing slightly, but there is no accumulation. [Neutral]
- ADX (14): 40.4 and rising steadily from 20.6 on Oct 19. −DI is 39.5 against +DI at 10.0, so sellers dominate. This is a strong, mature downtrend, and readings above 40 can sometimes precede exhaustion. [Strong Trend – Bearish]
- Volume: 59.44M is far above the average seen over most of the past year, and it has been elevated through the whole breakdown. Heavy volume on red candles shows aggressive distribution and possible capitulation. A volume climax would need a hold above the low to confirm a bottom. [Bearish / Possible Capitulation]
DIVERGENCES & TRENDS
- There is no clear bullish RSI divergence. Price made a lower low on Nov 5 ($43.66) and RSI also made a lower low (28.7), so momentum confirms price.
- The trend is bearish across the board. Price is below the EMA 39, EMA 156, SMA39D ($72.21), SMA156D ($90.87) and VWAP ($86.38). The SMA39D is already below the SMA156D (a death cross in place), and the EMA 39 is below the EMA 156.
- The MACD bearish crossover happened around Oct 19 and has only strengthened since.
- The ADX rise from about 20 to 40 shows a strong trend emerging from the prior sideways phase ($85–$95 from Aug to mid-Oct).
- CMF improving toward zero while price makes new lows is a mild early sign of selling fatigue, but it is not a divergence signal yet.
- Price near the lower Bollinger Band with RSI around 30 raises the odds of a relief bounce, but the trend is still down.
CHART PATTERNS
- Breakdown from a consolidation range or bearish pennant/flag: Price traded sideways in a tightening range at about $85–$95 from Aug to mid-Oct, then broke down sharply. This is similar to the Bearish Pennant/Flag in the reference diagram. The measured move from the prior range suggests a leg well below $60, which has largely been achieved.
- Descending channel behavior: Lower highs ($63.93 on Oct 28, $53.74 on Nov 3) and lower lows ($43.66) form a steep downtrend. A bounce toward $54–$58 would likely be a bearish retest.
- Possible Bullish Falling Wedge: The slope is compressing slightly, with RSI holding above 25. This is a low-probability reversal setup that would need a break above $54–$55.
- No bullish reversal pattern, such as a double bottom, is confirmed.
POTENTIAL SCENARIOS
- Scenario 1: Bearish Trend Continuation — The downtrend persists with −DI dominant and ADX above 35. Rallies stall below the EMA 39 and the $54–$55 area, and price retests or breaks the lower Bollinger Band. Trigger: daily close below $43.66 (the recent low) and then $40.90. Target: $38–$41, with an extreme low near $35. Invalidation: a daily close above $55 on rising volume. (50% probability)
- Scenario 2: Bullish Capitulation Bounce — Heavy volume marks a washout, RSI turns up from the low 30s, and a mean-reversion rally begins toward the middle Bollinger Band. Trigger: a close above $54.87 with MACD histogram contraction. Target: $58–$62 (the EMA 39 area is out of reach in the base case). Invalidation: a close below $43. (30% probability)
- Scenario 3: Neutral Basing Range — Price stabilizes between $40 and $55 as selling exhausts, and ADX rolls over from 40. Trigger: repeated holds of the $41–$44 zone with falling volume. Target: $44–$50. Invalidation: a close outside the $40–$55 range. (20% probability)
PRICE TARGETS
Range width check: $13.00 / $46.40 = 28%, which fits the 61–180 day guidance (18–30%) for this 83-day horizon.
- Target Price: $41.00 (83 days)
- Expected Range: $35.00 to $48.00
- Key Levels: Support at $40.90 (lower Bollinger Band), Resistance at $54.87 (Oct 30 close and recent lower high)
OVERALL BIAS
OVERALL BIAS: BEARISH - Price sits below every moving average with a death cross in place. MACD is below its signal and still widening, ADX is at 40 with −DI at 39.5 against +DI at 10, and volume is heavy on the selling. Oversold RSI and the lower Bollinger Band argue for bounces along the way, but the evidence favors lower prices by the target date.
This is educational analysis and not financial advice.