F 83-day bullish forecast — Nov 8, 2026
- Bias: Bullish
- Timeframe: 83 days (made Nov 8, 2026, target date Jan 29, 2027)
- Price at analysis: $12.44
- Price target: $12.95
- Expected range: $11.40 – $14.00
- Result: Pending — graded after the close on Jan 29, 2027
Get a free AI analysis of F today
Analysis
TECHNICAL INDICATORS
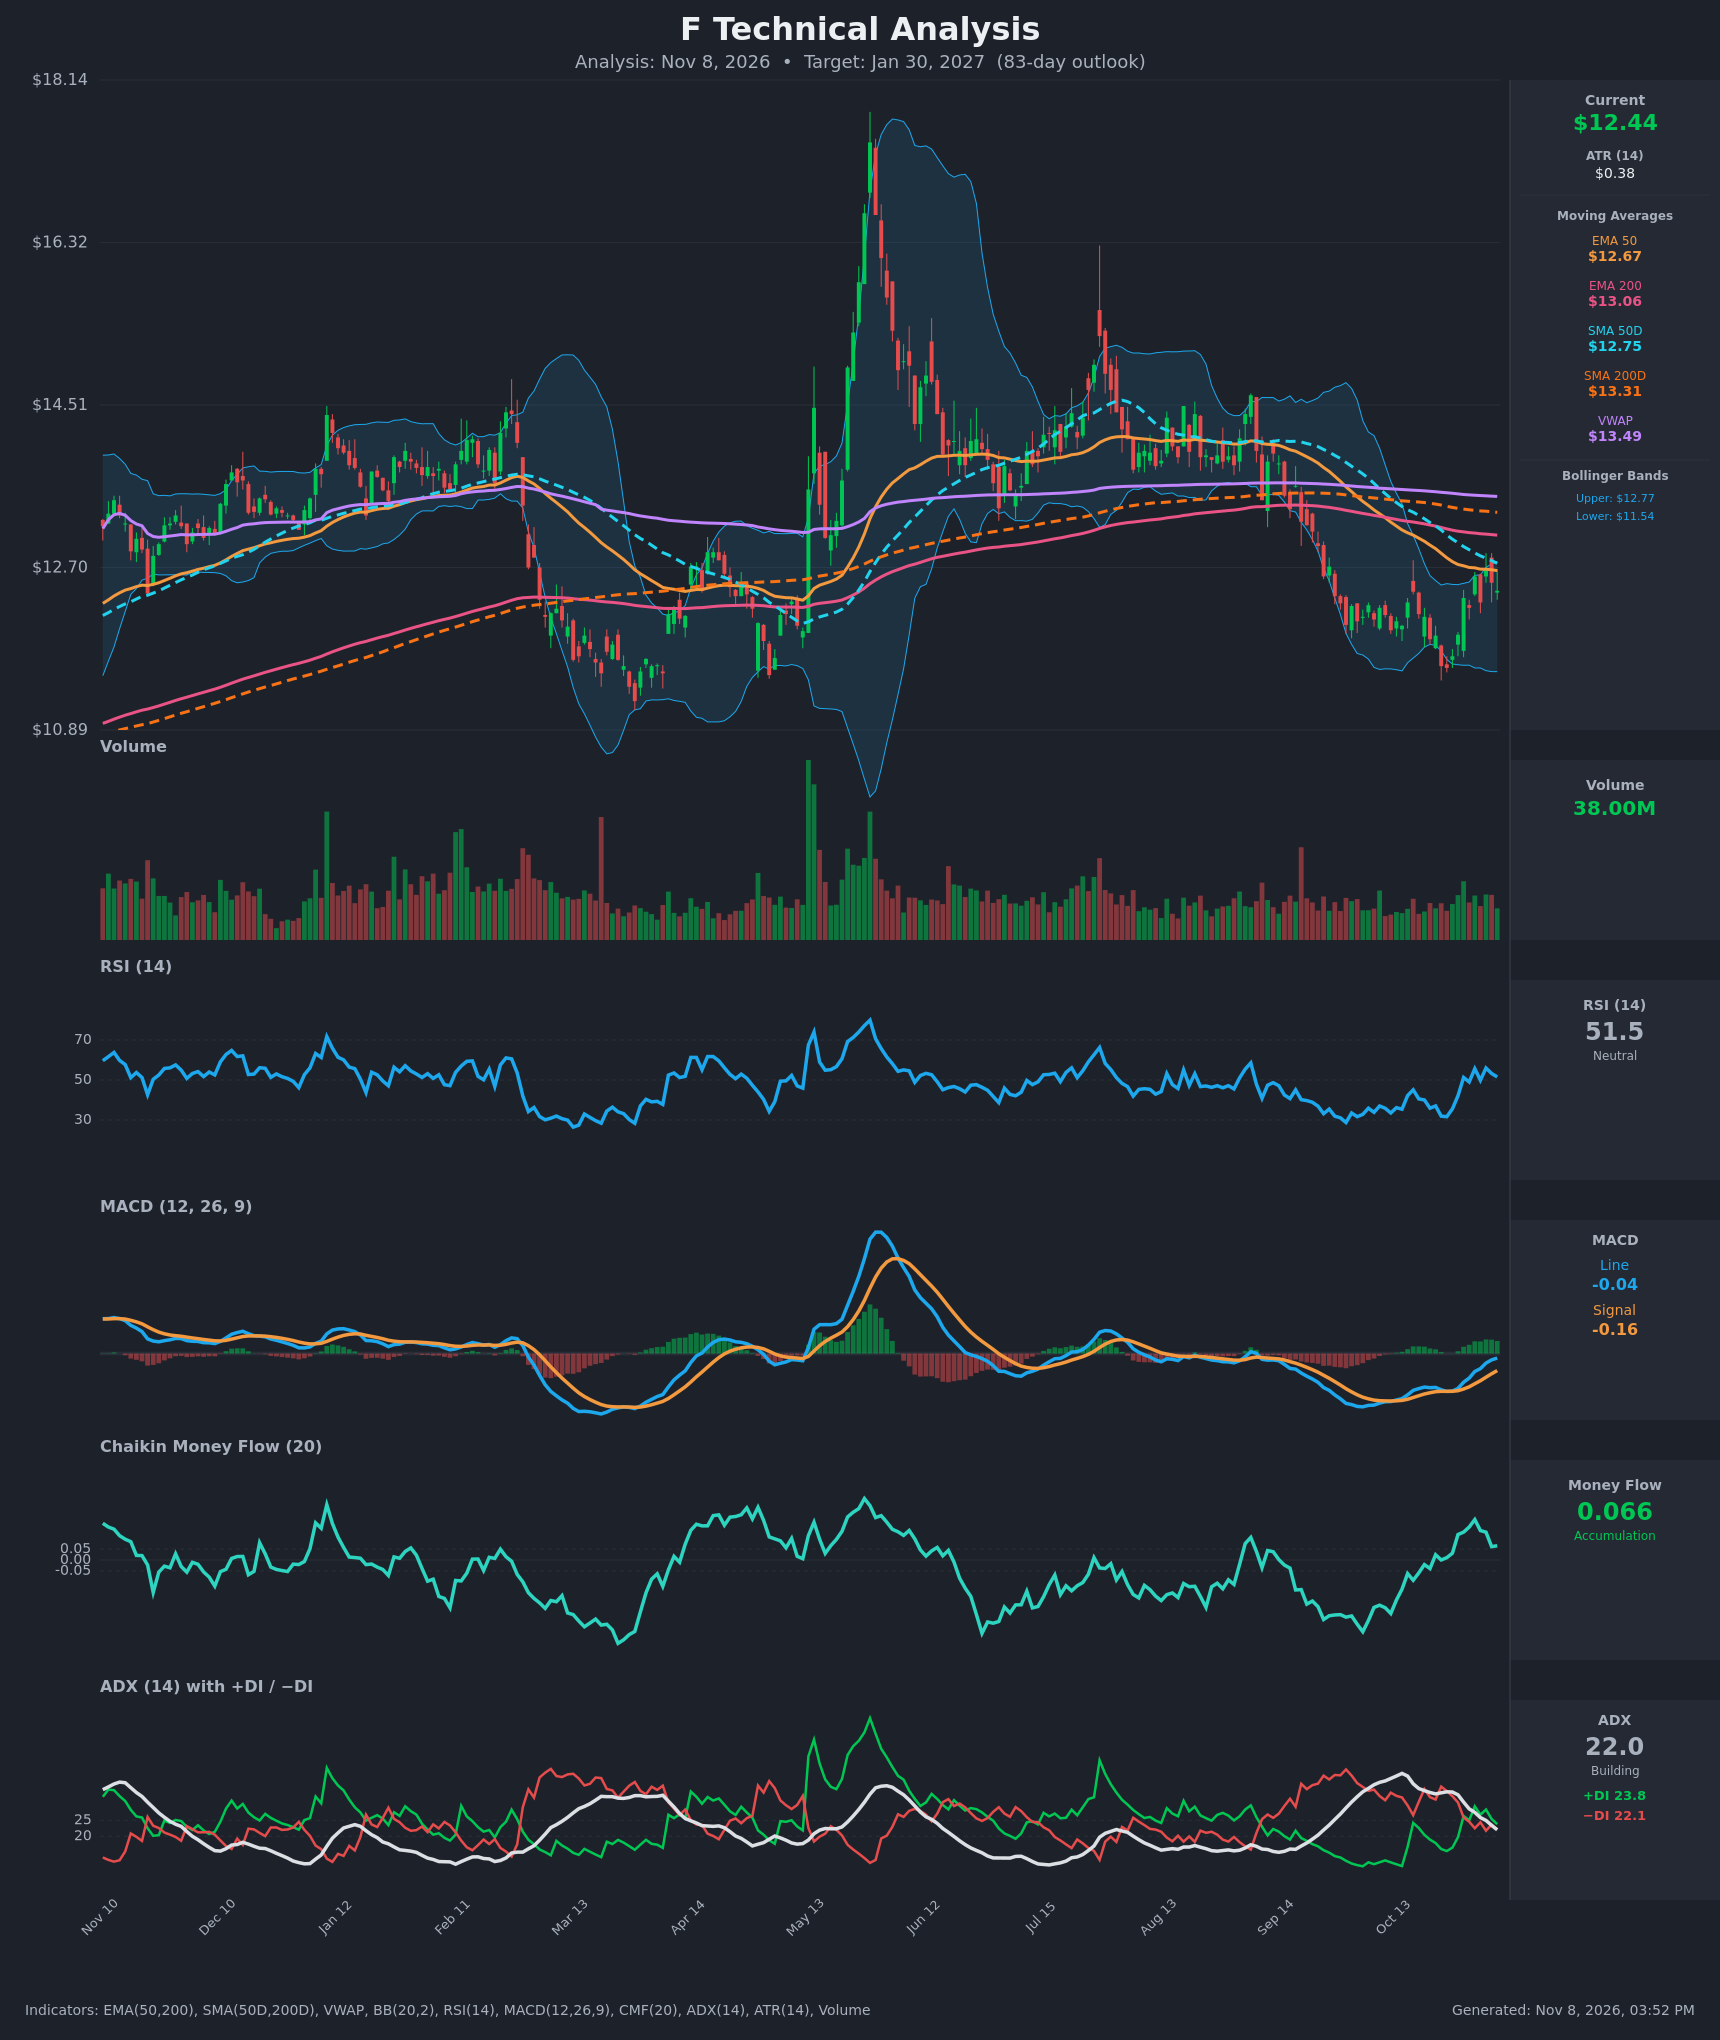
- RSI (14): 51.53, neutral and mid-range. It has recovered from the oversold-adjacent 31.7 on Oct 26, peaked near 56 on Nov 4, and is now flattening. Momentum has improved but is stalling at the 50 midline. [Neutral]
- 20 EMA: Not supplied. The 50 EMA at $12.67 is the nearest proxy, and price ($12.44) is below it. The 50 EMA is also below the 200 EMA ($13.06), and both are sloping down, so this is overhead resistance. [Bearish]
- MACD: Line -0.041 is below the signal at -0.156, but the gap has narrowed for 8 straight sessions (from -0.347 to -0.041). The histogram is positive and expanding. The line is approaching the zero line, so a bullish momentum shift is underway. [Bullish]
- Bollinger Bands (20): Upper $12.77, lower $11.54, midline about $12.15. Price is in the upper half of the bands, after a bounce off the lower band. The bands are narrow, which points to compression and a coming expansion. [Neutral]
- CMF (20): 0.066, just above the +0.05 accumulation threshold. It has been positive for 10 sessions but peaked at 0.186 and is fading. [Accumulation]
- ADX (14): 22.0 and falling from the 34 area, so the prior downtrend has lost strength. +DI (23.8) is only slightly above −DI (22.1), with a recent bullish DI crossover. The market is transitioning toward a range with a slight bullish lean. [Weak Trend, slightly bullish]
- Volume: 38.00M, around average with no climactic spike. The up days off the lows carried slightly better volume, but there is no strong breakout participation yet. [Neutral / mildly supportive]
DIVERGENCES & TRENDS
- Price made a low near $11.4 (Oct 23-26) while RSI bottomed at about 31.7. Momentum has since recovered faster than price, which is mildly bullish.
- The MACD line has been rising toward the signal and zero line for over a week, with an imminent bullish crossover. The histogram flipped positive.
- The moving averages are still bearishly stacked: price < SMA50D ($12.75) < EMA200 ($13.06) < SMA200D ($13.32) < VWAP ($13.49). The 50-day SMA is below the 200-day SMA, so the death cross is in place, and the gap is slowly narrowing.
- ADX has dropped from 34.9 to 22.0 and +DI has crossed above −DI. The bearish trend is exhausting, but no bullish trend has been confirmed.
- Price is still below the VWAP, so the overhead supply zone is $12.67-$13.50.
CHART PATTERNS
- Bullish Double Bottom (reversal): The lows near $11.4-$11.6 in late October, together with the earlier March and June troughs, form a base. The measured move from the ~$11.4 base to the ~$12.7 neckline is about $1.30, which projects to roughly $13.9-$14.0 on a confirmed break above $12.8.
- Symmetrical Triangle / Bullish Pennant (continuation, forming): Price is compressing between a rising low trendline (higher lows from $11.4) and the falling 50 EMA/SMA50D near $12.7. A break above $12.77 targets $13.3-$13.5 first (SMA200D/VWAP). A failure below $12.15 negates the base.
- The pattern is early and unconfirmed, so a breakout is needed.
POTENTIAL SCENARIOS
- Scenario 1: Bullish Base Breakout — A MACD bullish crossover and a close above the 50-day SMA/EMA ($12.67-$12.77) lead price to reclaim the EMA200 and test the SMA200D/VWAP zone. Trigger: daily close above $12.80 on rising volume. Target: $13.30-$13.50, with an extension to $14.00. Invalidation: close below $12.15 (Bollinger midline), then $11.54. (45% probability)
- Scenario 2: Neutral Range Consolidation — The low ADX and narrow bands keep price between the lows and the moving-average cluster. Trigger: repeated rejections at $12.70-$13.00 and holds above $11.90. Target: $12.00-$12.90. Invalidation: close above $13.10 or below $11.50. (28% probability)
- Scenario 3: Bearish Rejection and Retest of Lows — Price is rejected at the falling 50 EMA/200 EMA, the death-cross trend resumes, and DI flips back to −DI. Trigger: close below $12.15 and a MACD rollover. Target: $11.40-$11.55, with a possible lower low near $11.00. Invalidation: close above $13.06. (27% probability)
PRICE TARGETS
- Target Price: $12.95 (83-day, a modest drift toward the EMA200/SMA200D zone)
- Expected Range: $11.40 to $14.00 (width $2.60, about 20.9% of the current price, consistent with the 61-180 day guidance)
- Key Levels: Support at $12.15, Resistance at $12.77 (with the deeper support at $11.54 and the major overhead resistance at $13.31)
OVERALL BIAS
OVERALL BIAS: BULLISH - Momentum has turned up, with the MACD about to cross, CMF in accumulation, +DI above −DI, and a potential double-bottom base at $11.4-$11.6. The conviction is modest because price is still below the key moving averages and VWAP, with the death cross intact.
This is educational analysis and not financial advice.