DELL 83-day bearish forecast — Nov 8, 2026
- Bias: Bearish
- Timeframe: 83 days (made Nov 8, 2026, target date Jan 29, 2027)
- Price at analysis: $328.53
- Price target: $302.00
- Expected range: $262.00 – $345.00
- Result: Pending — graded after the close on Jan 29, 2027
Get a free AI analysis of DELL today
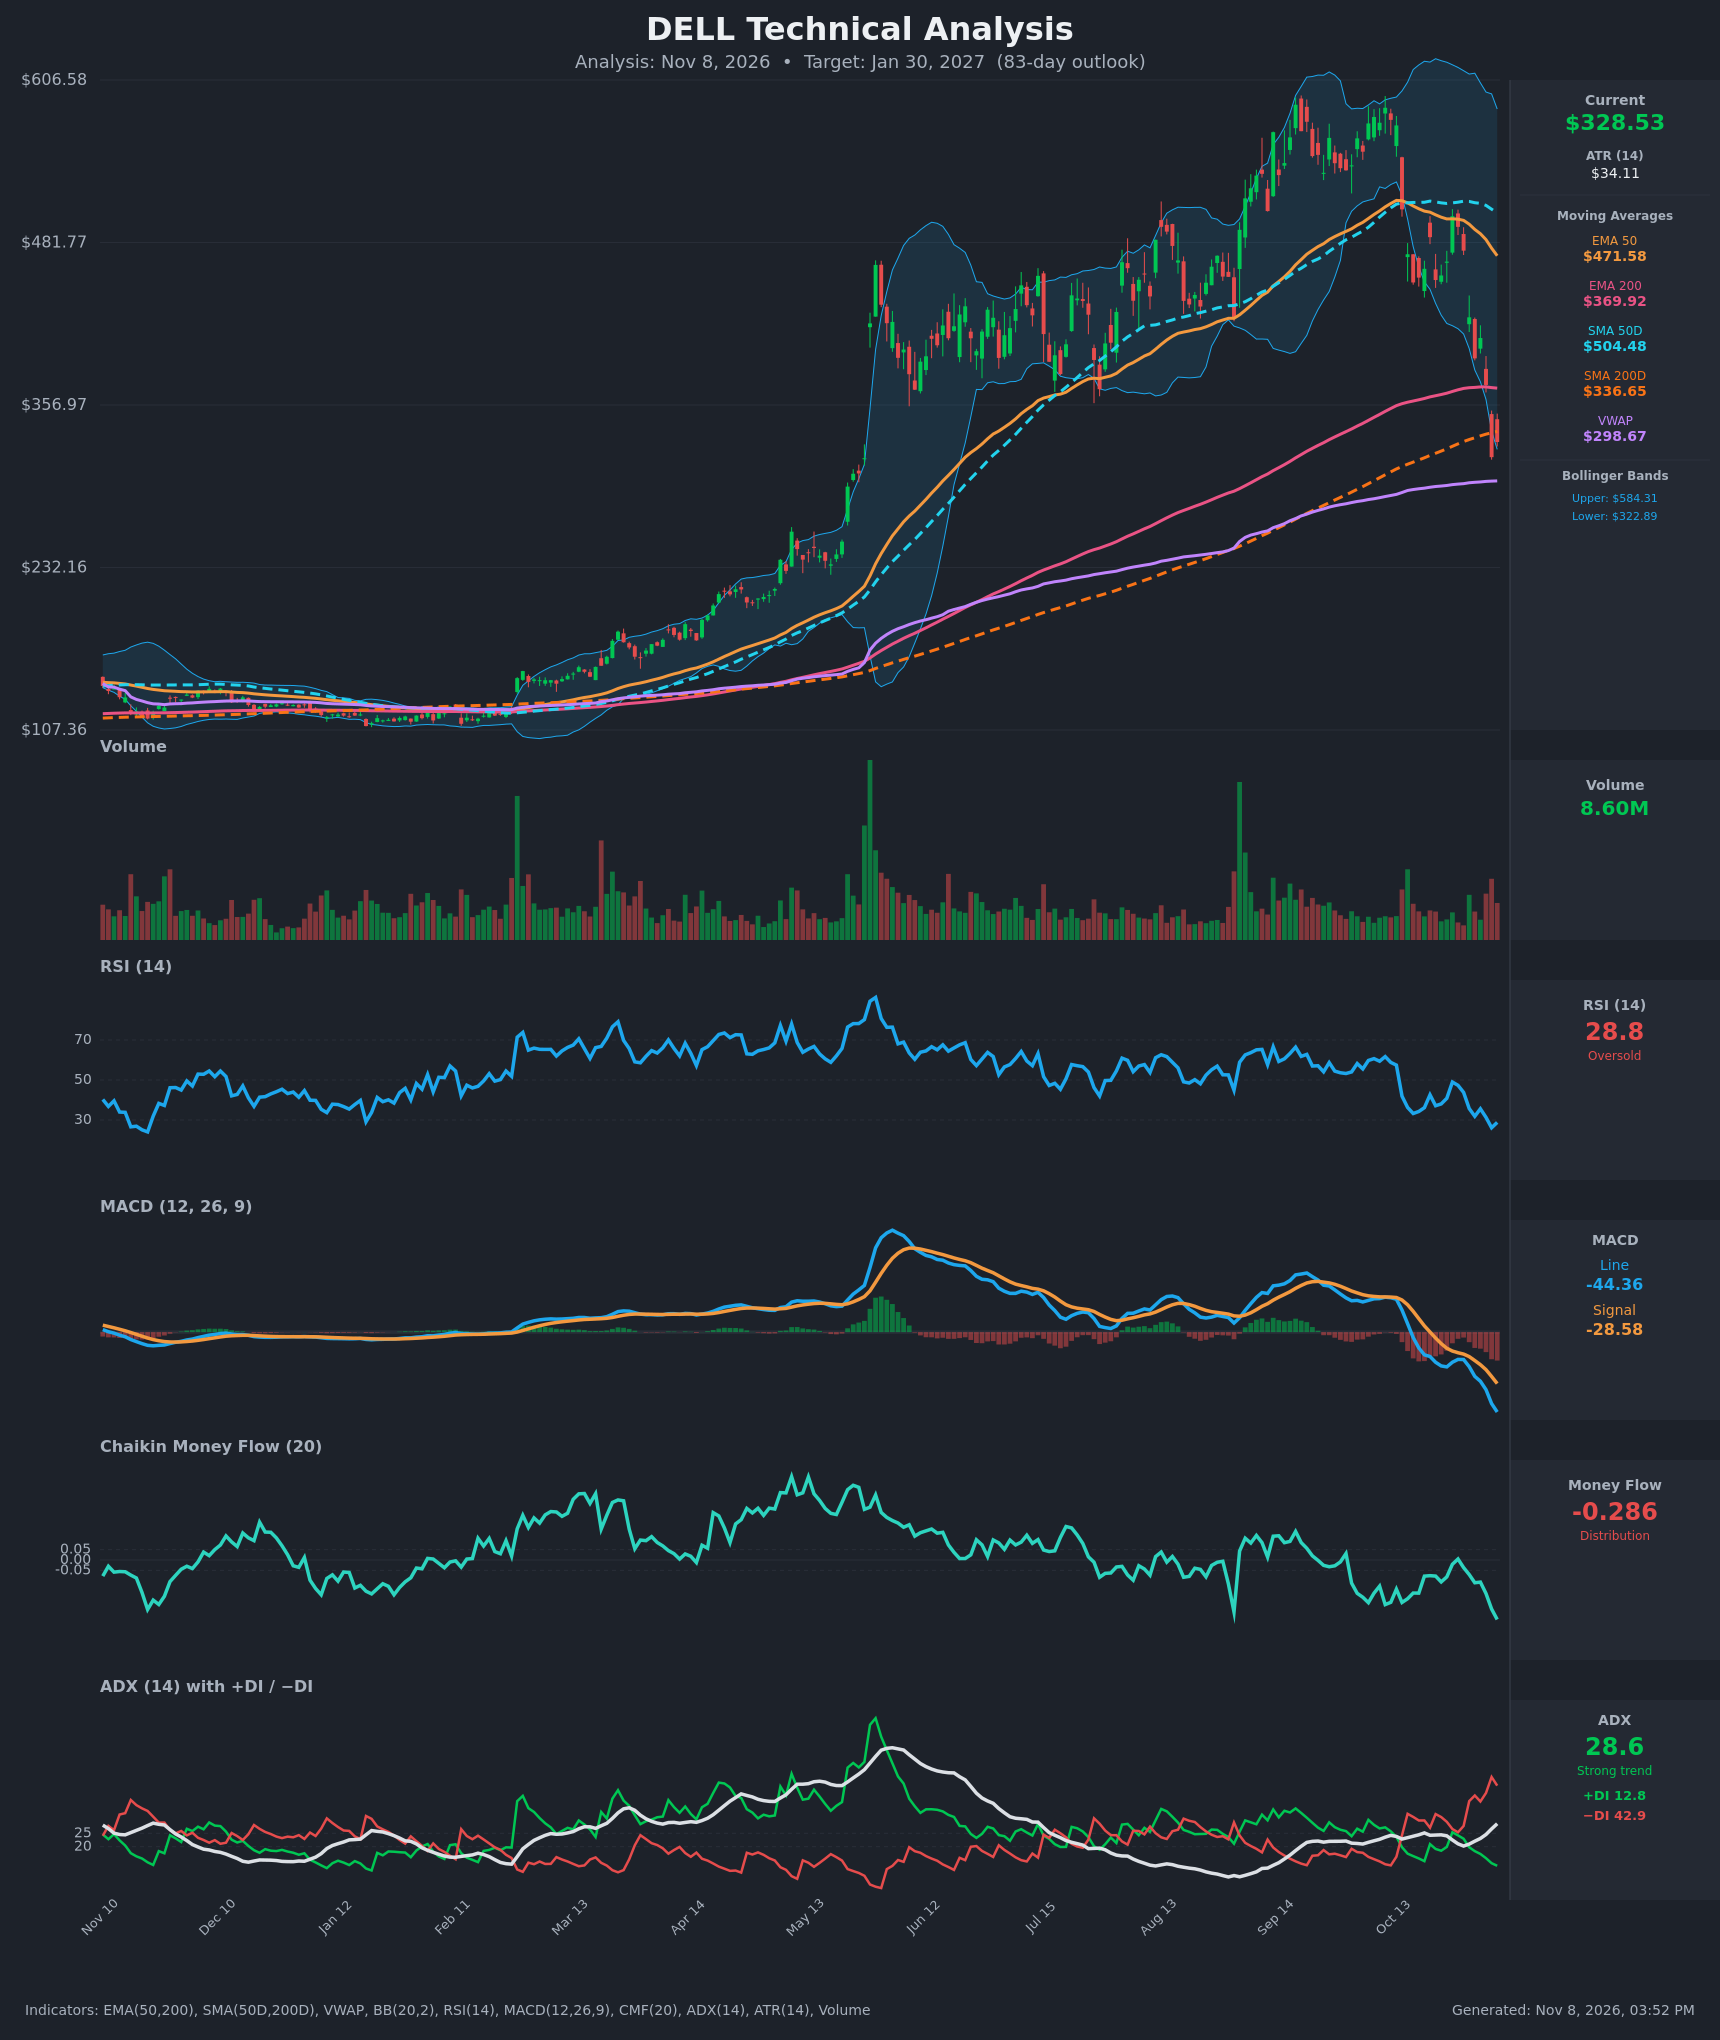
Analysis
TECHNICAL INDICATORS
- RSI (14): 28.79, in oversold territory after dropping from ~49 on Oct 27. It printed a low of 26.1 on Nov 5 and ticked up only slightly. Momentum is still pointing down, and there is no confirmed bullish divergence. [Bearish]
- 20 EMA: Not provided. As a proxy, EMA 50 is $471.58 and falling, and price at $328.53 is about 30% below it. That is heavy overhead resistance. EMA 200 at $369.92 is also overhead, so price has lost both. [Bearish]
- MACD: Line -44.36 is below signal -28.58, and the gap is widening. The line has been below the signal since about Oct 19, and the histogram is deeply negative and expanding. This is accelerating downside momentum. [Bearish]
- Bollinger Bands (20): Upper $584.31 and lower $322.89. Price at $328.53 is hugging the lower band after a very wide band expansion. This shows an extreme, volatile selloff, so a snap-back is possible. Walking the lower band in a strong trend usually means continuation rather than reversal. [Bearish]
- CMF (20): -0.286, well below -0.05 and at its lowest in the series. It has been negative for most of the last 15 bars and is worsening, which points to heavy, sustained distribution. [Distribution]
- ADX (14): 28.6 and rising from ~20 on Oct 29. It sits above 25, so the trend is strong. −DI at 42.9 is far above +DI at 12.8, so bears are in firm control. [Strong Trend – Bearish]
- Volume: 8.60M, with the latest bars showing elevated red volume on the breakdown from ~$470 to ~$317. Selling volume is expanding but has not reached the capitulation spikes seen in earlier rallies. [Bearish – active selling, no confirmed capitulation yet]
DIVERGENCES & TRENDS
- There is no bullish RSI divergence yet. RSI's low of 26.1 on Nov 5 coincided with the price low at $316.91. The Nov 6 bounce to $328.53 is only a modest uptick.
- The MACD line is at its lowest in the whole visible history, and the histogram is still expanding. Momentum has not bottomed.
- Price has moved from roughly $585 in September to $328, a decline of about 44%. It lost the rising EMA 50 and SMA 50D (~$504) in late October. It has now broken below SMA 200D ($336.65) and sits just under it.
- No death cross has occurred yet. SMA 50D ($504.48) remains above SMA 200D ($336.65), but the gap is narrowing quickly as SMA 50D rolls over. EMA 50 ($471.58) is above EMA 200 ($369.92) but is also falling fast.
- Price is above VWAP ($298.67), which is the next support. A breach would confirm further weakness.
- ADX is rising while −DI dominates, so the selloff is gaining trend strength rather than fading.
CHART PATTERNS
- Bearish topping structure (double top / expanding top with lower high): The September peak near $585 and the lower high near $500 on Oct 27 were followed by a breakdown through the $370–$400 area. This resembles the Bearish Double Top and Bearish Expanding Triangle reversals in the reference diagram.
- Gap-fill risk: The May surge from ~$300 to ~$450 left a large gap. Continued selling opens the door to a fill toward $230–$300 over time.
- Measured-move context: If the late-summer range ($350–$480) is treated as the base, a breakdown below $350 projects toward ~$250–$300. Price is currently testing that breakdown level.
- Counter-evidence: Price is at the lower Bollinger Band and RSI is below 30. A relief bounce toward $370 (the EMA 200 and the underside of the broken range) is plausible but would likely be a retest of resistance.
POTENTIAL SCENARIOS
- Scenario 1: Bearish Trend Continuation — The strong −DI, negative CMF and widening MACD gap keep sellers in control after the failed topping structure. Price loses VWAP and grinds lower with only weak bounces. Trigger: daily close below $316.91 (the recent low) and then below VWAP at $298.67. Target: $270–$300, with an extension toward $250. Invalidation: daily close above $370 (EMA 200) on rising volume. (50% probability)
- Scenario 2: Bullish Oversold Relief Bounce — The extreme oversold RSI and the lower-band touch spark a mean-reversion rally. Price reclaims SMA 200D and retests the EMA 200 area. Trigger: close above $336.65 with a bullish RSI divergence and MACD histogram contraction. Target: $370–$400. Invalidation: close below $316.91. (35% probability)
- Scenario 3: Neutral Base Building — Price stabilizes between VWAP and the EMA 200 as selling exhausts and ADX fades. Trigger: several closes between $300 and $360 with falling volume. Target: $320–$345. Invalidation: close outside $295–$370. (15% probability)
PRICE TARGETS
- Target Price: $302.00 (83-day, about -8% from the current price)
- Expected Range: $262.00 to $345.00. The width is $83, or about 25% of the current price, which fits the 61–180 day guidance of 18–30%.
- Key Levels: Support at $298.67 (VWAP), Resistance at $336.65 (SMA 200D, followed by $369.92 EMA 200)
OVERALL BIAS
OVERALL BIAS: BEARISH - The trend is strongly down: −DI of 42.9 sits far above +DI of 12.8, MACD is widening below its signal, CMF at -0.286 shows heavy distribution, and price has broken below the 50-period averages and SMA 200D after a failed topping structure. The extreme oversold reading leaves room for a bounce, but the evidence favors continued downside toward VWAP and lower.
This is educational analysis and not financial advice.