IBIT 83-day bearish forecast — Nov 8, 2026
- Bias: Bearish
- Timeframe: 83 days (made Nov 8, 2026, target date Jan 29, 2027)
- Price at analysis: $42.88
- Price target: $40.00
- Expected range: $36.00 – $45.50
- Result: Pending — graded after the close on Jan 29, 2027
Get a free AI analysis of IBIT today
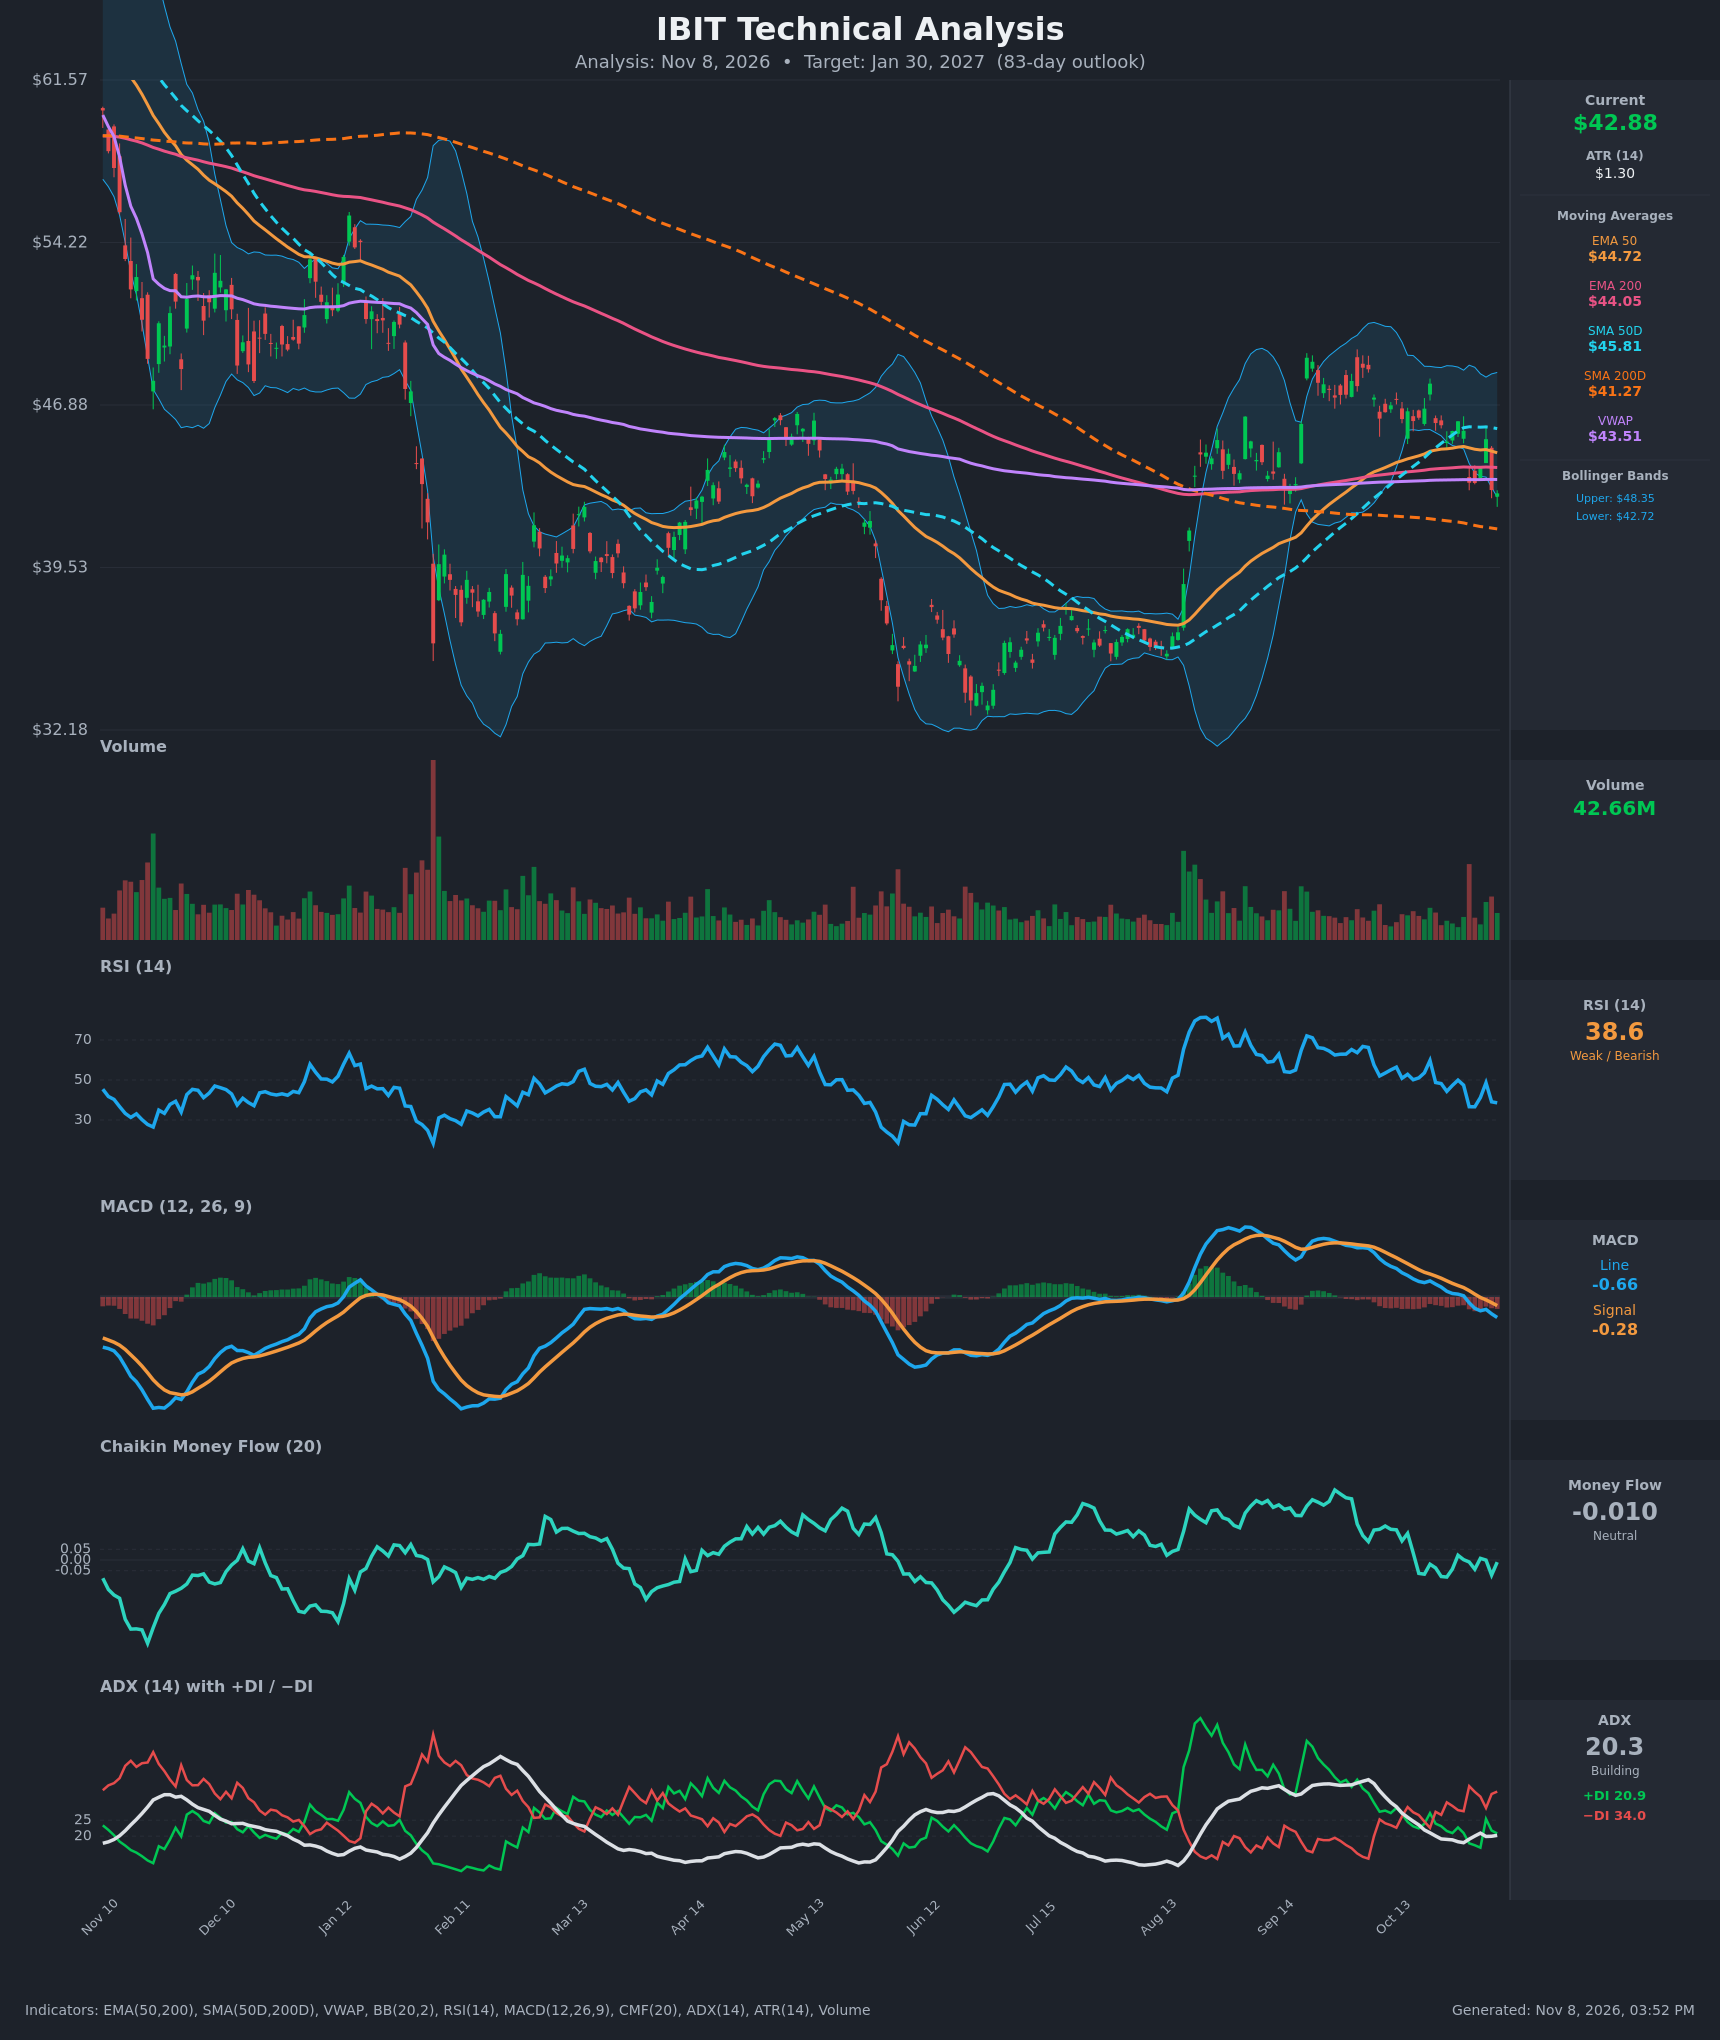
Analysis
TECHNICAL INDICATORS
- RSI (14): 38.57, down from about 49 on Nov 4. It is approaching the oversold zone but not there yet. Momentum is falling, with a lower high on each bounce. [Bearish]
- 20 EMA: Not supplied. Using the EMA 50 ($44.72) and EMA 200 ($44.05) as proxies, price at $42.88 is below both. Both have turned into overhead resistance, and the EMA 50 is rolling over toward the EMA 200. [Bearish]
- MACD: Line -0.663 is below signal -0.279. The bearish cross happened around Oct 30 to Nov 3, and both lines are now below zero. The histogram is negative and widening, so downside momentum is still increasing. [Bearish]
- Bollinger Bands (20): Price at $42.88 is pinned just above the lower band ($42.72), with the upper band at $48.35. That shows a downside push but also stretched short-term conditions, so a bounce toward the mid-band (~$45.5) is possible. A close below the lower band would signal continuation. [Bearish]
- CMF (20): -0.010, inside the neutral band (±0.05). It faded from sustained positive readings in Aug–Oct and has hovered around zero for the last few weeks. Buyers have stopped supporting price, but heavy distribution has not set in. [Neutral]
- ADX (14): 20.3 with -DI 34.0 above +DI 20.9. The trend is weak but bears control direction. ADX is edging up from 18, which suggests a nascent bearish trend. [Weak Trend, Bearish Direction]
- Volume: 42.66M, roughly average. The down days (Oct 30, Nov 5) carried slightly heavier volume than the bounces, with no capitulation spike. [Mildly Bearish]
DIVERGENCES & TRENDS
- There is no clear bullish RSI divergence yet. RSI and price are making lower lows together.
- The MACD bearish crossover was confirmed and is widening. RSI is below 40 after failing near 50 (Oct 28 at 49.9, Nov 4 at 48.6).
- The Oct 21 high ($47.84) was a lower high than the Sep peak (~$49), and price has since fallen to $42.88.
- The EMA 50 ($44.72) is only $0.67 above the EMA 200 ($44.05) and falling. A bearish EMA cross (death cross) is likely within weeks if weakness continues.
- The SMA 50D ($45.81) is above the SMA 200D ($41.27), so the golden cross remains intact. However, the SMA 50D has started to roll over.
- Price is below the VWAP ($43.51) and below both EMAs, while still above the rising SMA 200D ($41.27). That makes the SMA 200D the key long-term support.
- The DI lines show -DI has been dominant since Oct 30, with the gap widening to 13 points.
- CMF has faded from sustained accumulation to neutral, which fits a loss of buying support.
CHART PATTERNS
- The best fit is a Bearish Double Top with a loose second peak. The highs were around $49 (Sep) and around $47.8 (Oct 21), with a neckline near $43–43.5. Price is now testing the neckline. The measured move is about $5–6 below the neckline, pointing to roughly $37–38. That also matches the August gap area around $36–37.
- A secondary read is a Bearish Flag / Rising Wedge in the Sep–Oct rally, with lower highs after the surge. A break of the lower trendline supports the same downside target.
- A longer-term range of about $33–$49 frames the overall structure. That range is wide enough to leave room for a bounce within the broader decline.
POTENTIAL SCENARIOS
- Scenario 1: Bearish Neckline Break and Drift to Gap Support — The double-top neckline fails, the MACD and DI bearish readings persist, and the EMA 50 crosses below the EMA 200. Price loses the SMA 200D and fills toward the August gap area. Trigger: daily close below $42.70 (the lower Bollinger Band) and then $41.27. Target: $38.00–$40.00, with an extension to $36.50. Invalidation: daily close back above $45.00 (EMA 50/EMA 200 cluster). (55% probability)
- Scenario 2: Neutral Range Bounce — The SMA 200D and lower band hold. RSI mean-reverts from near 35 and price chops between $41 and $45.5 as ADX stays near 20. Trigger: a bounce off $41.27–$42.70 with RSI holding above 30. Target: $43.50–$45.00. Invalidation: close below $41.00 or above $46.00. (25% probability)
- Scenario 3: Bullish Recovery — The pullback proves to be a retest of support, and buyers reclaim the moving averages. CMF turns positive and price retakes the EMA 200 and VWAP. Trigger: close above $45.00 with a MACD re-cross. Target: $47.50–$49.00 (the Sep–Oct highs). Invalidation: close below $41.00. (20% probability)
PRICE TARGETS
- Target Price: $40.00 (83-day horizon, about -6.7%)
- Expected Range: $36.00 to $45.50 (width $9.50, about 22% of current price, consistent with the 61–180 day guidance)
- Key Levels: Support at $41.27 (SMA 200D), Resistance at $44.05 (EMA 200, with the VWAP at $43.51 as the first hurdle)
OVERALL BIAS
OVERALL BIAS: BEARISH - Price is below the VWAP, EMA 50 and EMA 200, with a bearish MACD cross, -DI well above +DI, and weakening RSI. A double-top neckline is being tested, which points toward the SMA 200D and the August gap area. A bounce from the lower Bollinger Band is possible, and low ADX limits conviction.
This is educational analysis and not financial advice.