IBM 83-day bearish forecast — Nov 8, 2026
- Bias: Bearish
- Timeframe: 83 days (made Nov 8, 2026, target date Jan 29, 2027)
- Price at analysis: $245.00
- Price target: $238.00
- Expected range: $215.00 – $263.00
- Result: Pending — graded after the close on Jan 29, 2027
Get a free AI analysis of IBM today
Analysis
TECHNICAL INDICATORS
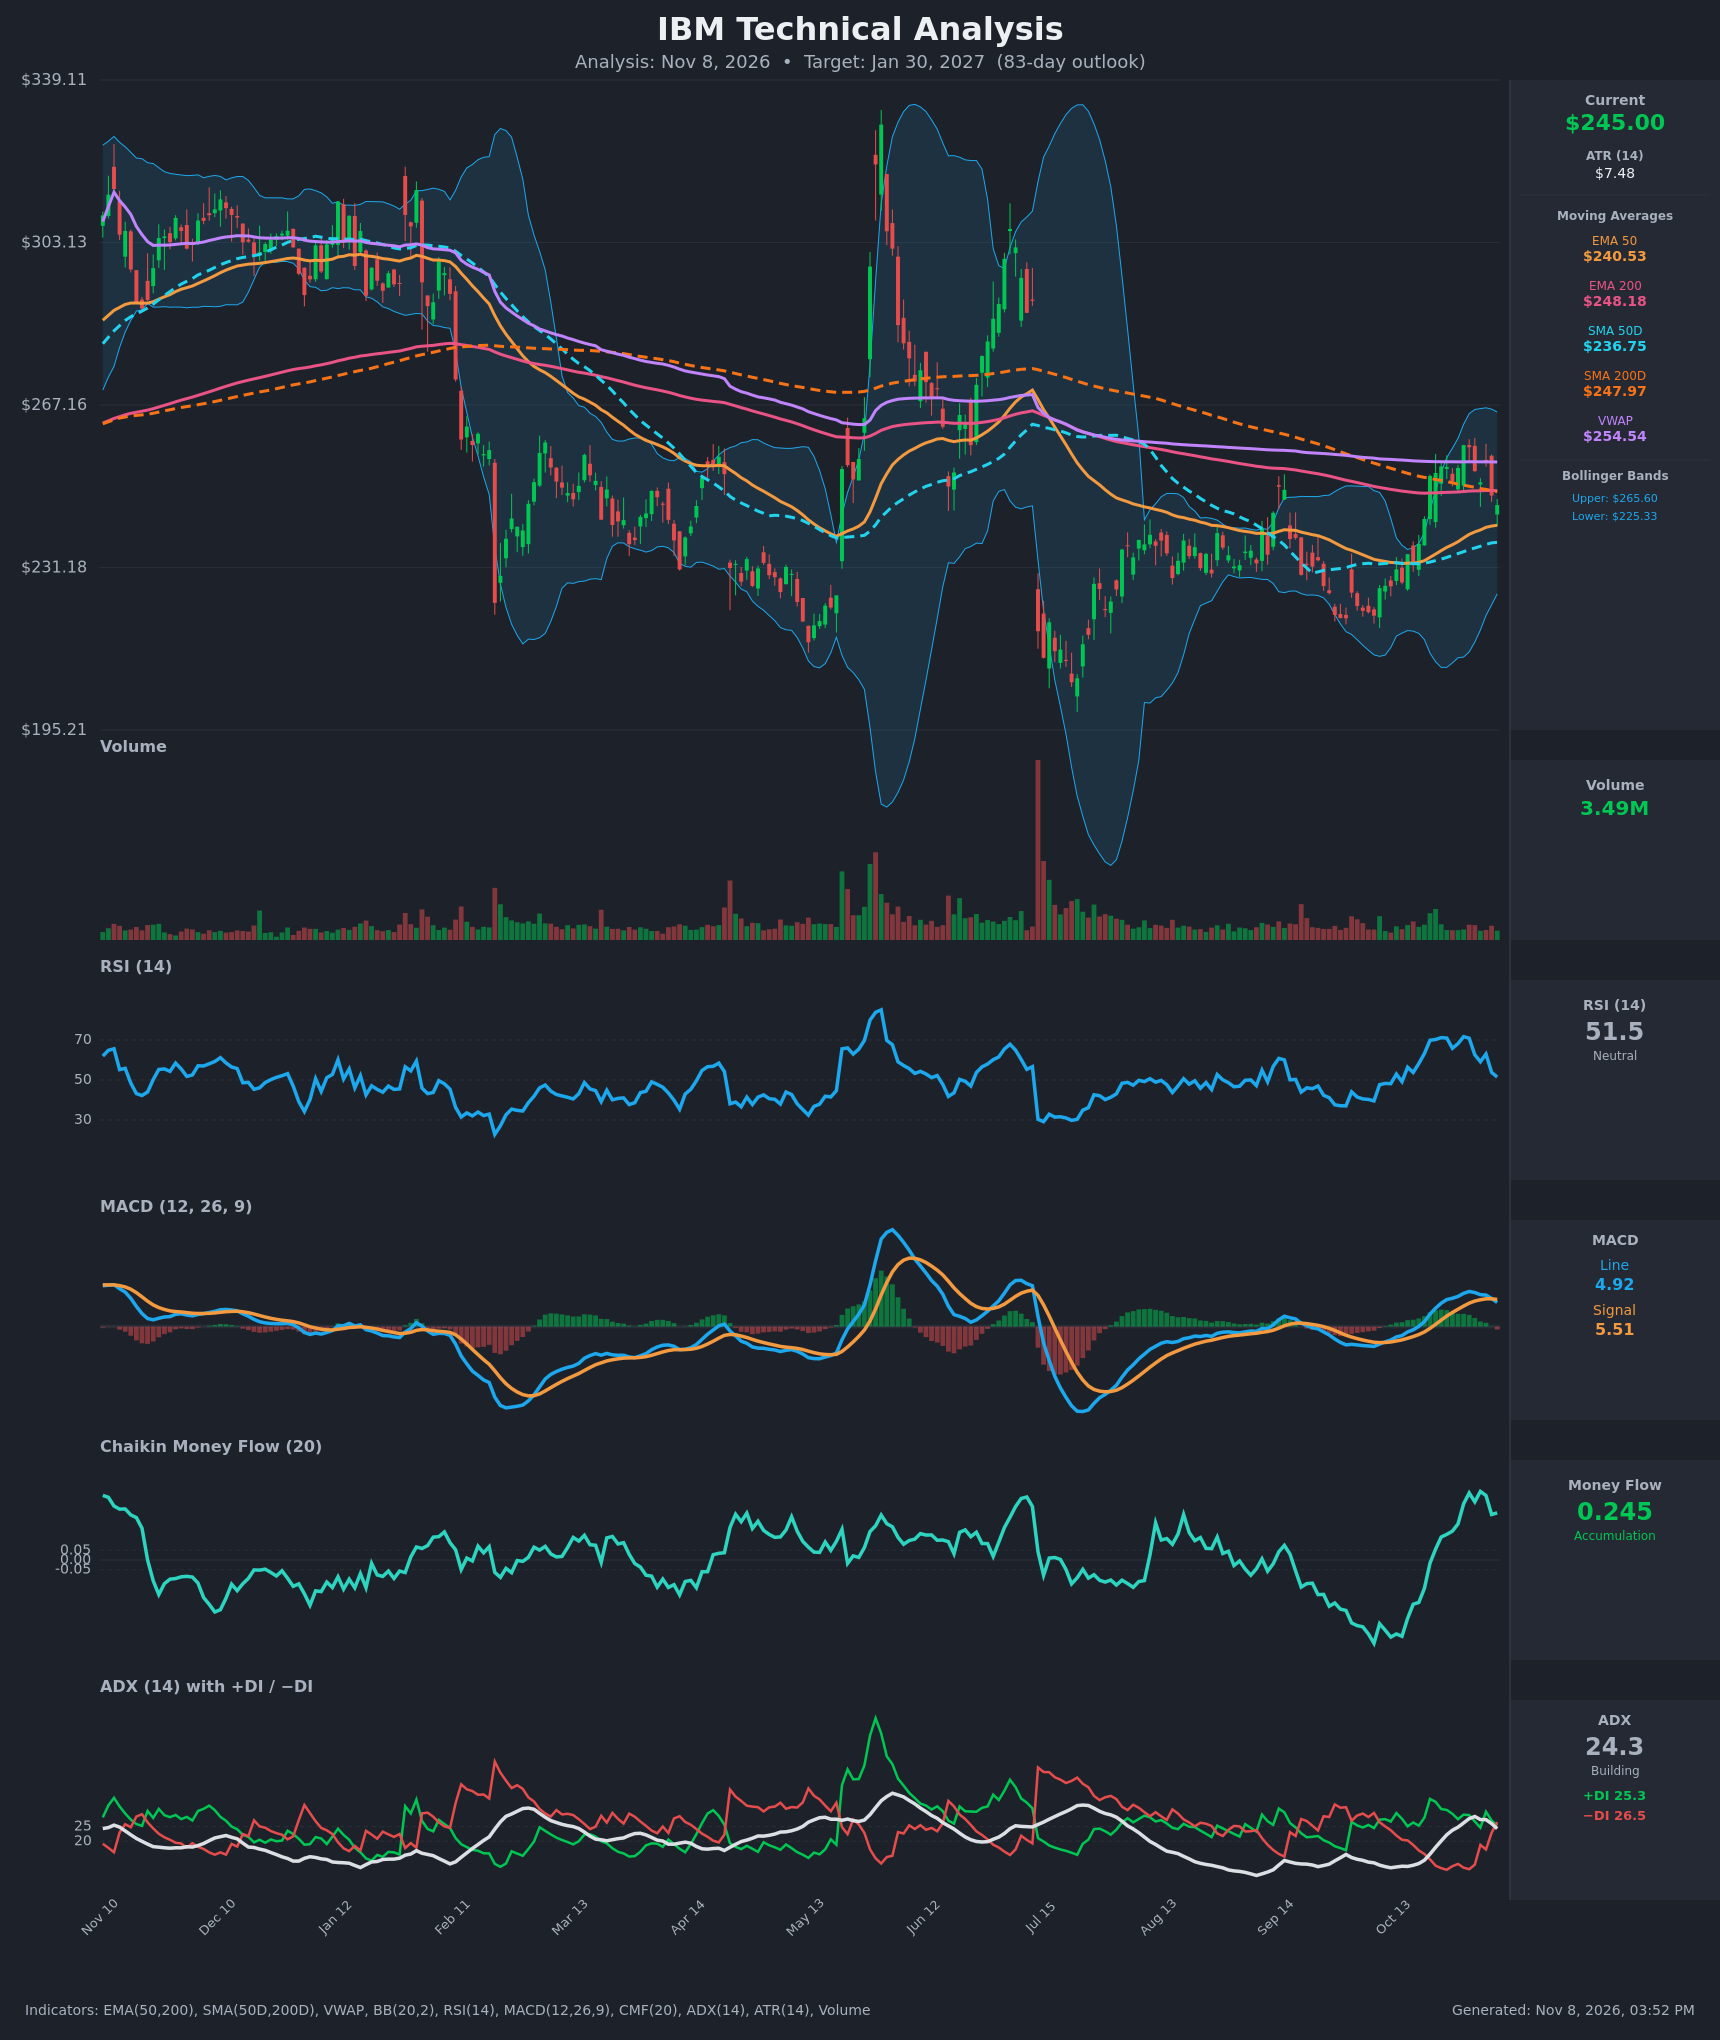
- RSI (14): 51.46, down sharply from 71 on Oct 29-30 and now back at the 50 midline. Momentum has rolled over from overbought but has not broken into bearish territory (<40). [Neutral]
- 20 EMA: The 20 EMA isn't provided, so I use the EMA 50 at $240.53 as the nearest dynamic average. Price ($245.00) is above it by about 1.9%, and the EMA is still rising, so it acts as near-term support. Price remains below the EMA 200 ($248.18). [Neutral]
- MACD: Line 4.92 against signal 5.51, a fresh bearish crossover on Nov 6 after the line peaked at 7.14 on Oct 30. The histogram has turned negative. The line is still positive, so this is a momentum fade rather than a full downtrend. [Bearish]
- Bollinger Bands (20): Upper $265.60, lower $225.33, midline about $245.47. Price sits right on the midline after being rejected near the upper half ($258). The bands are fairly wide, so volatility is elevated, and there is no squeeze or band-walk signal. [Neutral]
- CMF (20): 0.245, well above +0.05. It has been positive and rising since mid-October, a swing from deeply negative readings. This is genuine accumulation, but it dipped from 0.356 as price pulled back. [Accumulation]
- ADX (14): 24.3, just under the 25 trend threshold and down from 28.4. −DI (26.5) has crossed above +DI (25.3), and −DI has risen from 10 to 26 in two weeks. This is a weak trend with bears just taking control. [Weak Trend, Bearish tilt]
- Volume: 3.49M, in line with the average and well below the spikes seen on prior large moves. The recent rally and the pullback both came on unremarkable volume, so neither side shows decisive conviction. [Neutral]
DIVERGENCES & TRENDS
- MA structure: Price ($245.00) is below the SMA 200 ($247.97) and EMA 200 ($248.18), so the long-term trend is still down. The SMA 50 ($236.75) remains below the SMA 200, which means no golden cross. The gap is narrowing (about $11, versus about $19 in mid-October). The EMA 50 ($240.53) is also below the EMA 200.
- VWAP: Price is below VWAP ($254.54), which suggests overhead supply and sellers in control on a volume-weighted basis.
- RSI and MACD: Both peaked on Oct 29-30 and have fallen since. Price made a lower high on Nov 4 ($254.32 against $258.28), and RSI made a lower high (63 against 72). That is a mild bearish divergence.
- ADX/DI: The −DI/+DI bearish crossover on Nov 6, together with the MACD bearish cross, is a clear momentum shift. ADX is still below 25, so it is not yet confirmed.
- CMF: It diverges bullishly from price action, holding strong positive readings through the pullback. This is the main counterweight to the bearish signals.
- Trend: The multi-month picture is a lower-high sequence from the $320s down to $258, with a base forming in the $215-230 area. The Oct rally stalled exactly at the 200-day cluster and VWAP.
CHART PATTERNS
- Bearish Double Top (minor): Peaks at $258.28 and about $254, with a neckline near $250. Price has now closed below it ($245). The measured move is about $8, giving a target near $242. The pattern is small, so it is only a modest signal.
- Larger structure: The $220-$258 range since the autumn low looks like a broad base or consolidation under the descending 200-day averages. This is not a clean diagram pattern, but a rejection at the 200-day band keeps it a lower-high structure. A decisive close above $258 would turn it into a bullish reversal.
- Targets: The pullback may find first support at the EMA 50 ($240.53) and then the SMA 50 ($236.75). A deeper failure points to the lower Bollinger Band ($225.33).
POTENTIAL SCENARIOS
- Scenario 1: Bearish Rejection at the 200-Day Cluster — Price failed at the EMA/SMA 200 and VWAP, MACD and DI have crossed bearish, and the double-top neckline is broken. Price drifts lower toward the rising 50-day averages and possibly tests the August-October lows. Trigger: daily close below $240.50 (EMA 50). Target: $236-$238, with an extension to $225-$230. Invalidation: daily close above $258. (45% probability)
- Scenario 2: Bullish Reclaim of the 200-Day Averages — CMF accumulation and rising 50-day averages support a bounce. A reclaim of $248-$255 would push toward the upper band as the SMA 50 closes in on the SMA 200. Trigger: close above $255 (VWAP) on rising volume. Target: $265-$270. Invalidation: close below $236.75. (35% probability)
- Scenario 3: Neutral Range Chop — Weak ADX and a flat midline keep price between the 50-day and 200-day averages. Trigger: price oscillating between $236 and $255 with no decisive breakout. Target: $240-$250. Invalidation: close outside $234-$258. (20% probability)
PRICE TARGETS
Timeframe: 83 days (Jan 30, 2027). The 61-180 day band calls for roughly 18-30% width.
- Target Price: $238.00
- Expected Range: $215.00 to $263.00 (width $48 = 19.6% of the current price, consistent with the 83-day guidance)
- Key Levels: Support at $236.75, Resistance at $248.18
OVERALL BIAS
OVERALL BIAS: BEARISH - Price was rejected at the 200-day averages and VWAP, MACD and DI have both crossed bearish, and the minor double-top neckline has broken. Price is still below the long-term trend, and the SMA 50 remains below the SMA 200. Strong CMF accumulation limits the downside, so conviction is modest and the target is a drift toward the 50-day averages rather than a collapse.
This is educational analysis and not financial advice.