HOOD 83-day bearish forecast — Nov 8, 2026
- Bias: Bearish
- Timeframe: 83 days (made Nov 8, 2026, target date Jan 29, 2027)
- Price at analysis: $80.91
- Price target: $73.00
- Expected range: $64.00 – $86.00
- Result: Pending — graded after the close on Jan 29, 2027
Get a free AI analysis of HOOD today
Analysis
TECHNICAL INDICATORS
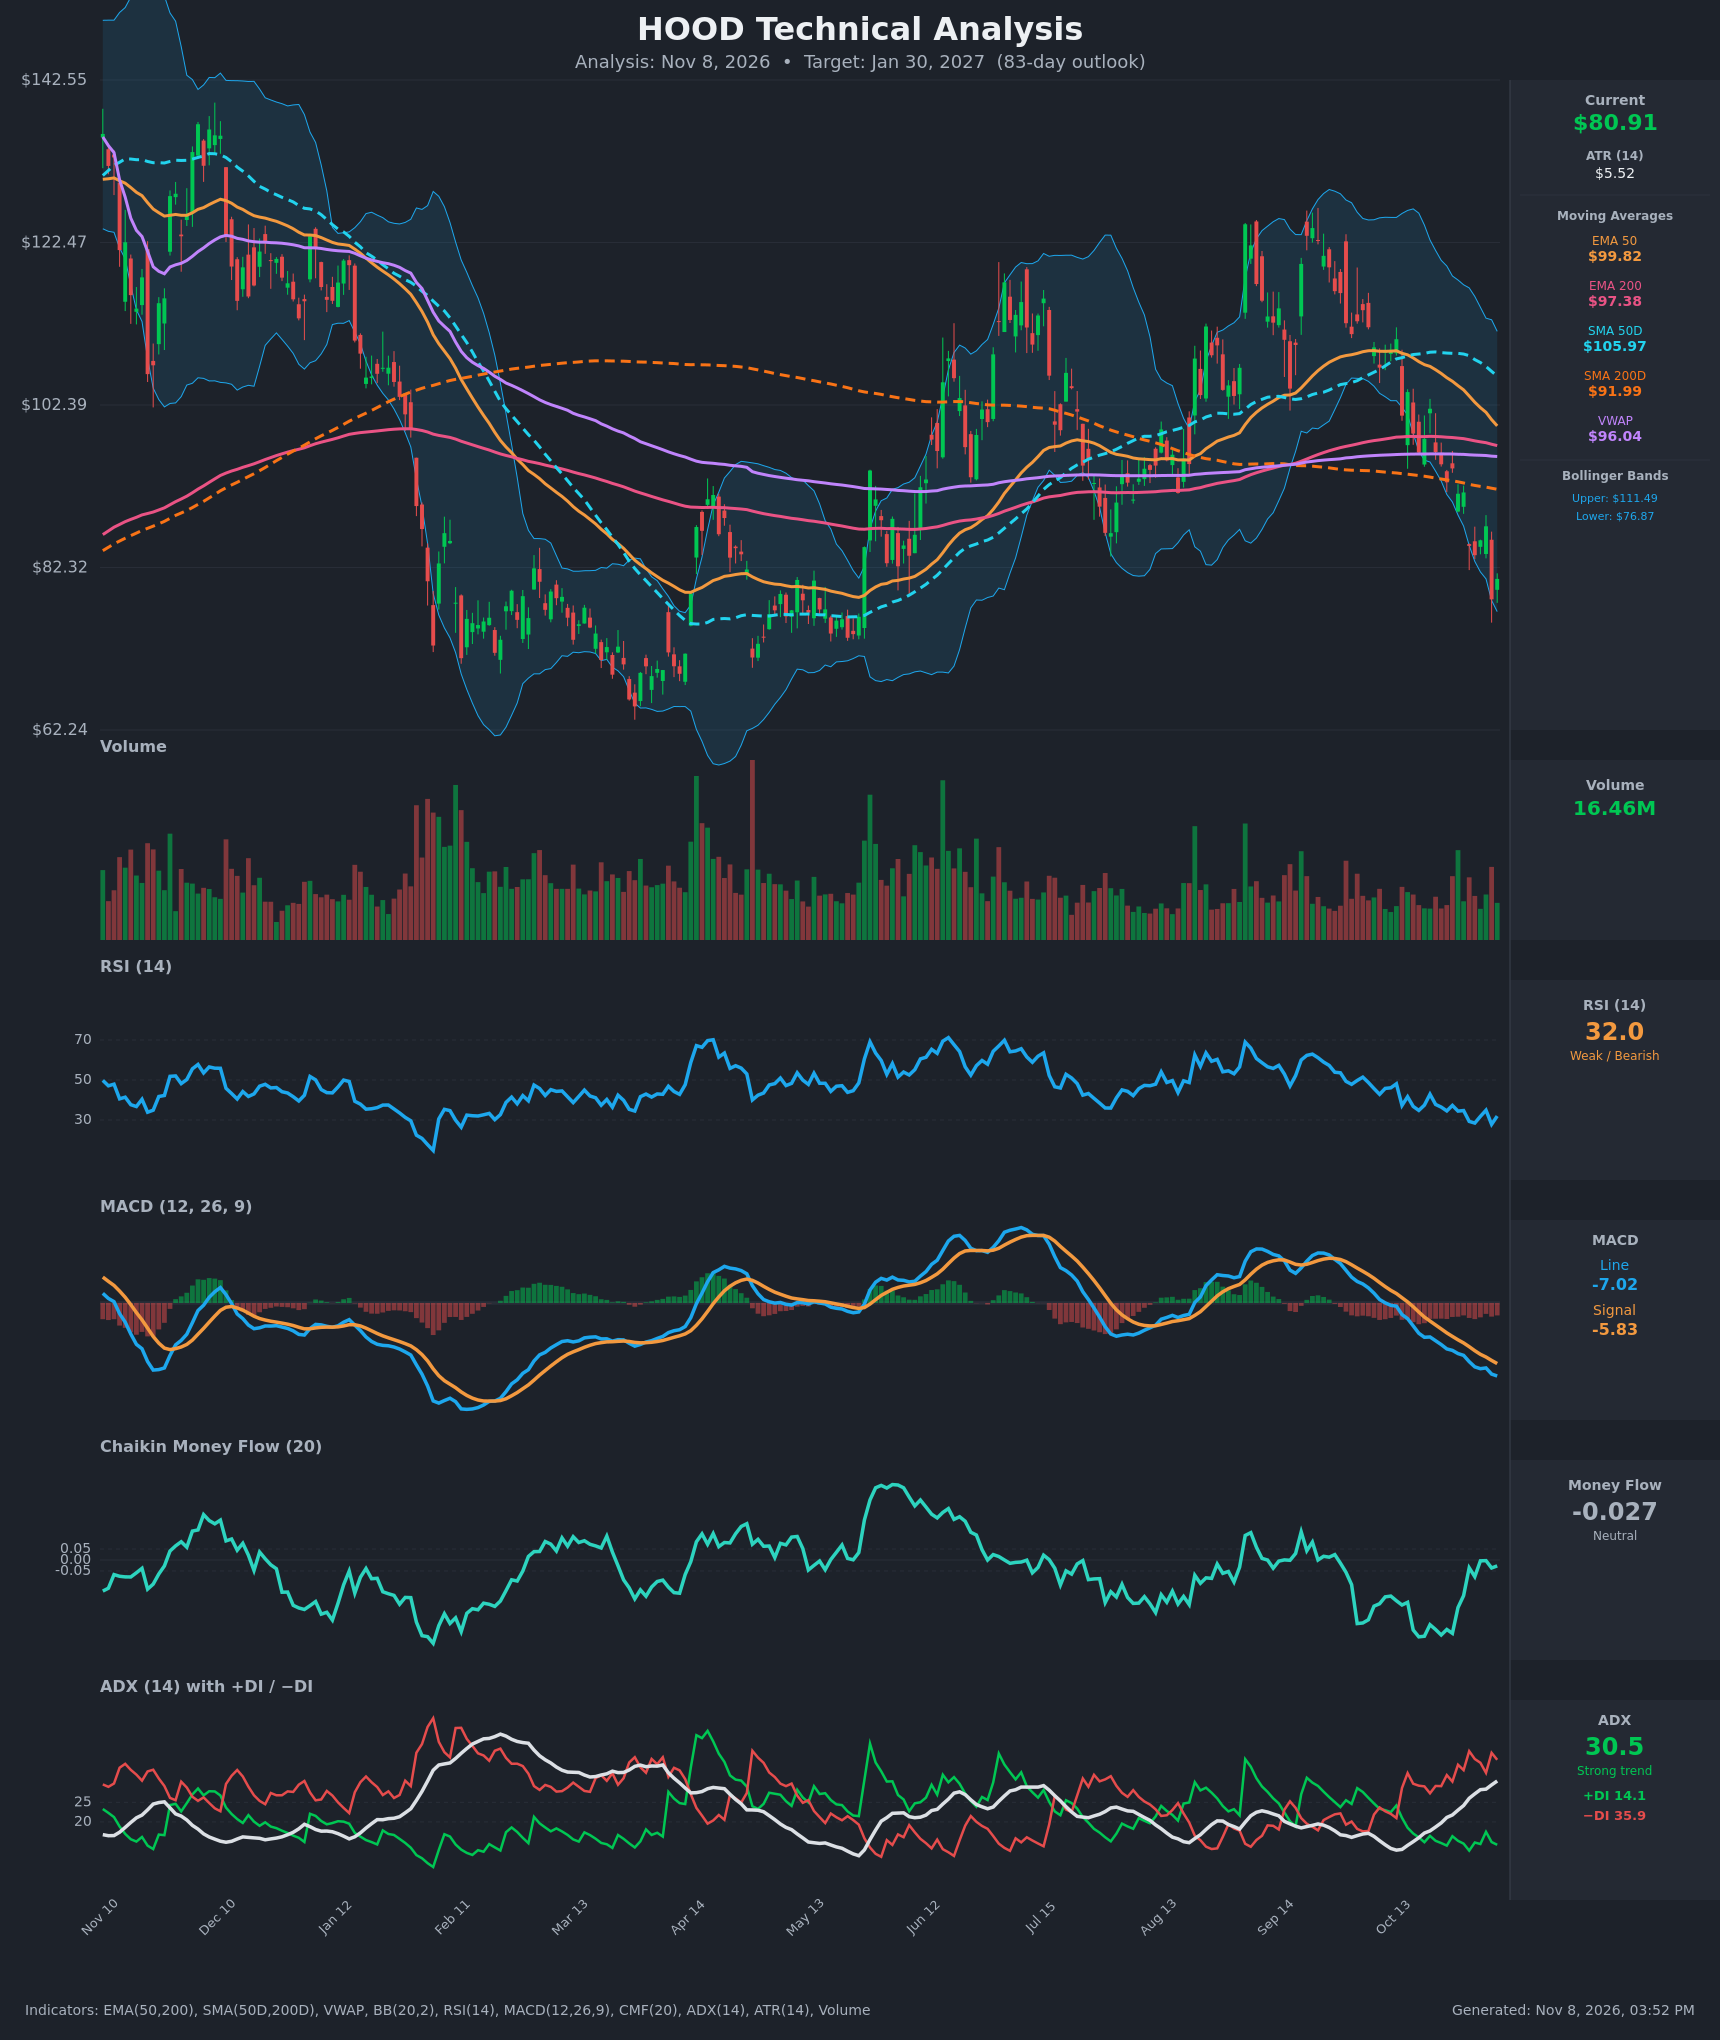
- RSI (14): 31.97, just above oversold. It bottomed at 27.8 on Nov 5 and has bounced only slightly. It has stayed below 50 since early October, so momentum is weak and a relief bounce is possible, but there is no bullish divergence yet. [Bearish]
- 20 EMA: The 20 EMA was not supplied. The EMA 50 ($99.82) and EMA 200 ($97.38) are both well above the $80.91 price. The EMA 50 crossed below the EMA 200 around Nov 6, a bearish crossover. Price sits about 19% below the EMA 50, so these averages act as heavy overhead resistance. [Bearish]
- MACD: The line (-7.02) is below the signal (-5.83) and both are below zero. The bearish crossover has been in place for roughly two weeks, and the line keeps making new lows. The histogram is negative and widening, so downside momentum is still building. [Bearish]
- Bollinger Bands (20): Price is $80.91 against a lower band of $76.87 and an upper band of $111.49, and the bands are wide and expanding. Price is hugging the lower half and recently pushed through the lower band (Nov 5 close of $78.39). That shows a strong downtrend, but price is also stretched about 1.2 ATR above the lower band. A short-term bounce toward the mid-band (~$94) is possible. [Bearish]
- CMF (20): -0.027 sits inside the ±0.05 neutral zone. It has improved from -0.35 in mid-October, so selling pressure has eased, but there is no accumulation. Price is making new lows while CMF is flat, which is a mild positive. [Neutral]
- ADX (14): 30.5 and rising, with -DI (35.9) far above +DI (14.1). This is a strong, established downtrend with bears firmly in control, and no sign of a DI crossover. [Strong Trend – Bearish]
- Volume: 16.46M, average for the recent range, and the last bar is small and green. There was no capitulation volume spike during the Oct 30 and Nov 5 drops, so a definitive selling-exhaustion low has not been confirmed. [Neutral to Mildly Bearish]
DIVERGENCES & TRENDS
- Death cross risk: The SMA 50D ($105.97) is falling toward the SMA 200D ($91.99), and the gap narrowed from $15 to $14 in two weeks. Price is also below the SMA 200D, so the long-term trend has turned down.
- Price vs VWAP: Price is $15 below VWAP ($96.04), which signals persistent selling pressure.
- No bullish divergence: RSI made a lower low (27.8) as price made a lower low, so momentum confirms the decline. MACD is making new lows as well.
- Trend: The drop from the Sep high of about $127 to $80.91 is roughly a 36% decline. The Oct 19 – Nov 6 closes fell from $96.52 to $80.91 with lower highs on every bounce.
- ADX: ADX has risen from 16 to 30.5 in three weeks, so the downtrend is accelerating, not fading.
- CMF: CMF has recovered to neutral, which is the only constructive divergence. It supports a bounce but does not signal a reversal.
CHART PATTERNS
- Bearish double top / broken range: The June and September highs ($118–127) formed two peaks, and price has since broken through the ~$92–96 neckline area, which coincides with the SMA 200D and VWAP. The measured move is the peak-to-neckline distance of about $30–34 projected from the neckline, which points to roughly $60–65, near the prior April low (~$62–65).
- Lower highs: Each bounce since September has failed at a lower level (Oct 21 at $101.93, Nov 4 at $87.41), consistent with a developing descending structure.
- Counter-pattern: The April–May base around $72–78 was a strong accumulation zone. A hold there could produce a bullish double-bottom or falling-wedge reversal. That is not yet confirmed.
- Target: The measured-move target of $60–65 is the extreme case. For 83 days I use a more conservative target because RSI is oversold.
POTENTIAL SCENARIOS
- Scenario 1: Bearish Trend Continuation — Price stays below the falling EMA 50 and SMA 200D, the MACD gap widens, and −DI stays dominant. Sellers push price through the lower band and the $72–77 base. Trigger: daily close below $76.87 on rising volume. Target: $70–73, with an extension to $64–65 (April low). Invalidation: daily close above $91.99 (SMA 200D). (55% probability)
- Scenario 2: Bullish Oversold Relief Rally — RSI below 32 and price at the lower band trigger a mean-reversion bounce, and CMF turns positive. Price rallies to the mid-band area and then fails under the declining averages. Trigger: close above $87.41 with RSI above 45. Target: $92–96 (SMA 200D / VWAP). Invalidation: close below $76.87. (30% probability)
- Scenario 3: Neutral Base Building — Price consolidates in the $72–88 zone as selling exhausts and ADX fades below 25. Trigger: ADX falling and price repeatedly holding above $76. Target: $78–86. Invalidation: close outside $70–92. (15% probability)
PRICE TARGETS
For the 83-day horizon (target date Jan 30, 2027):
- Target Price: $73.00
- Expected Range: $64.00 to $86.00 (width $22 ≈ 27% of the current price, consistent with the 61–180 day guidance)
- Key Levels: Support at $76.87 (lower Bollinger Band, then the $72–75 base and $62–65 April low), Resistance at $91.99 (SMA 200D, with VWAP and the EMAs above)
OVERALL BIAS
OVERALL BIAS: BEARISH - Price is below every major moving average, the EMA 50 has crossed below the EMA 200, MACD is below its signal with a widening histogram, and ADX at 30.5 with −DI at 35.9 shows a strong, accelerating downtrend. The oversold RSI and neutral CMF argue for bounces, so the 83-day target of $73.00 is moderately lower, with resistance at $91.99.
This is educational analysis and not financial advice.